Monitor
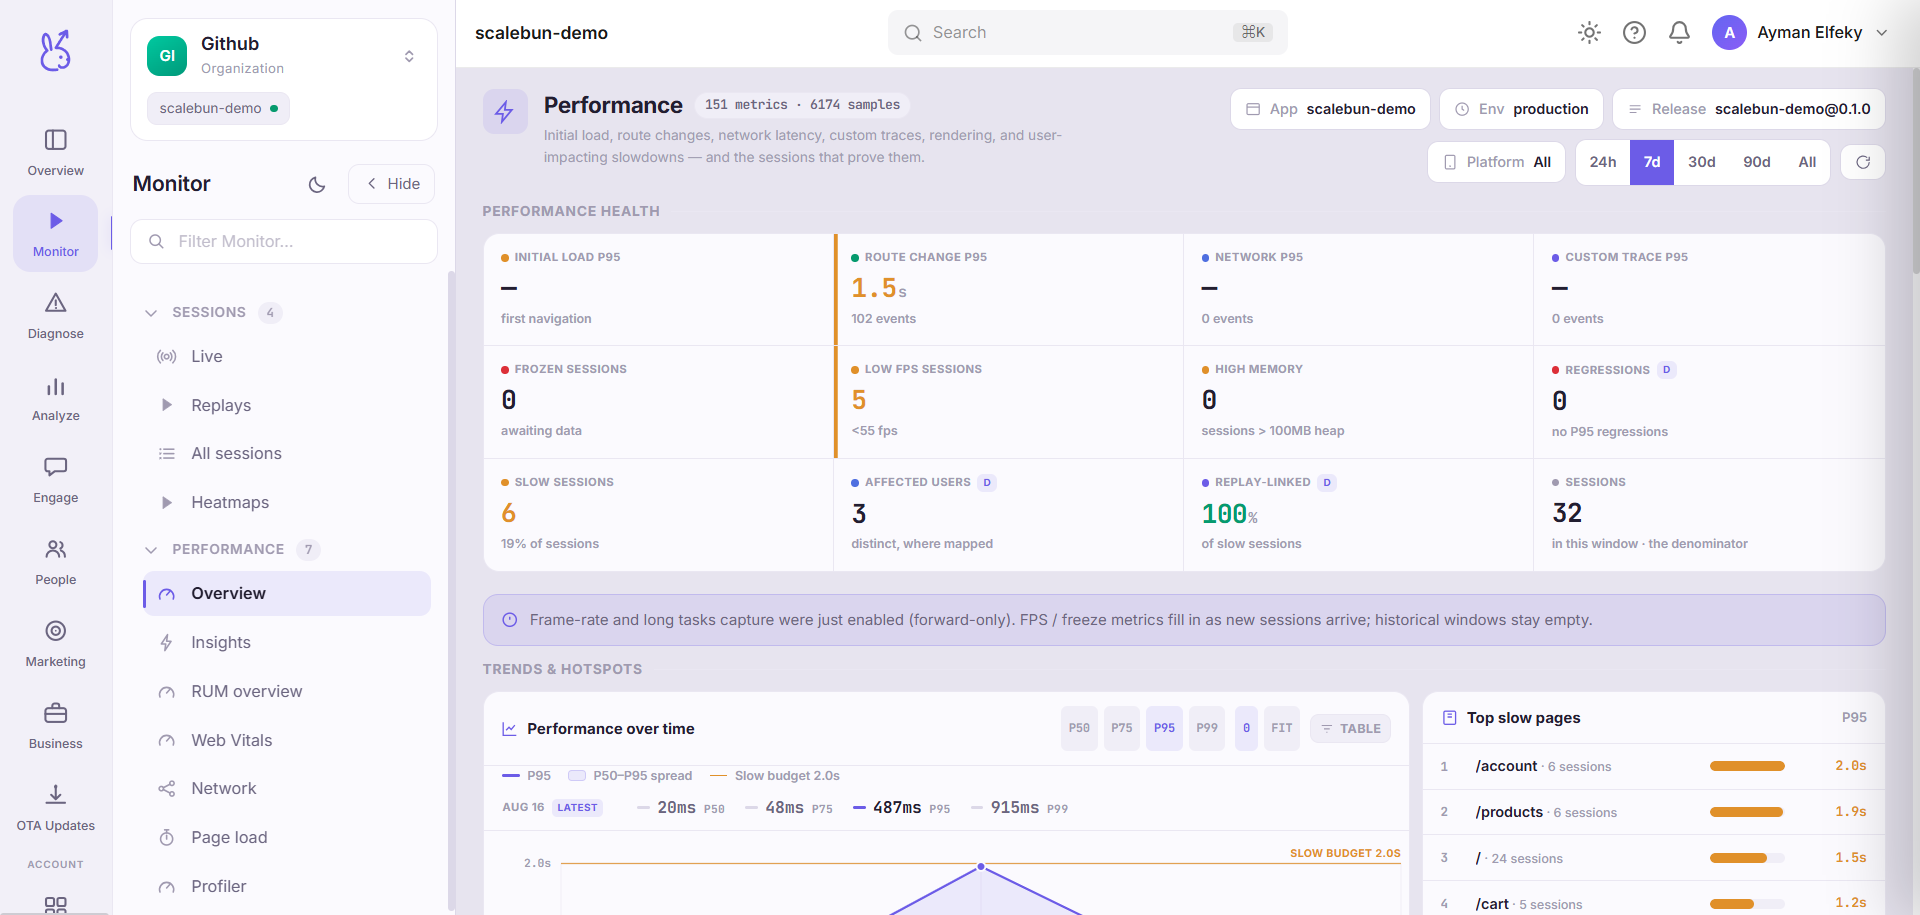
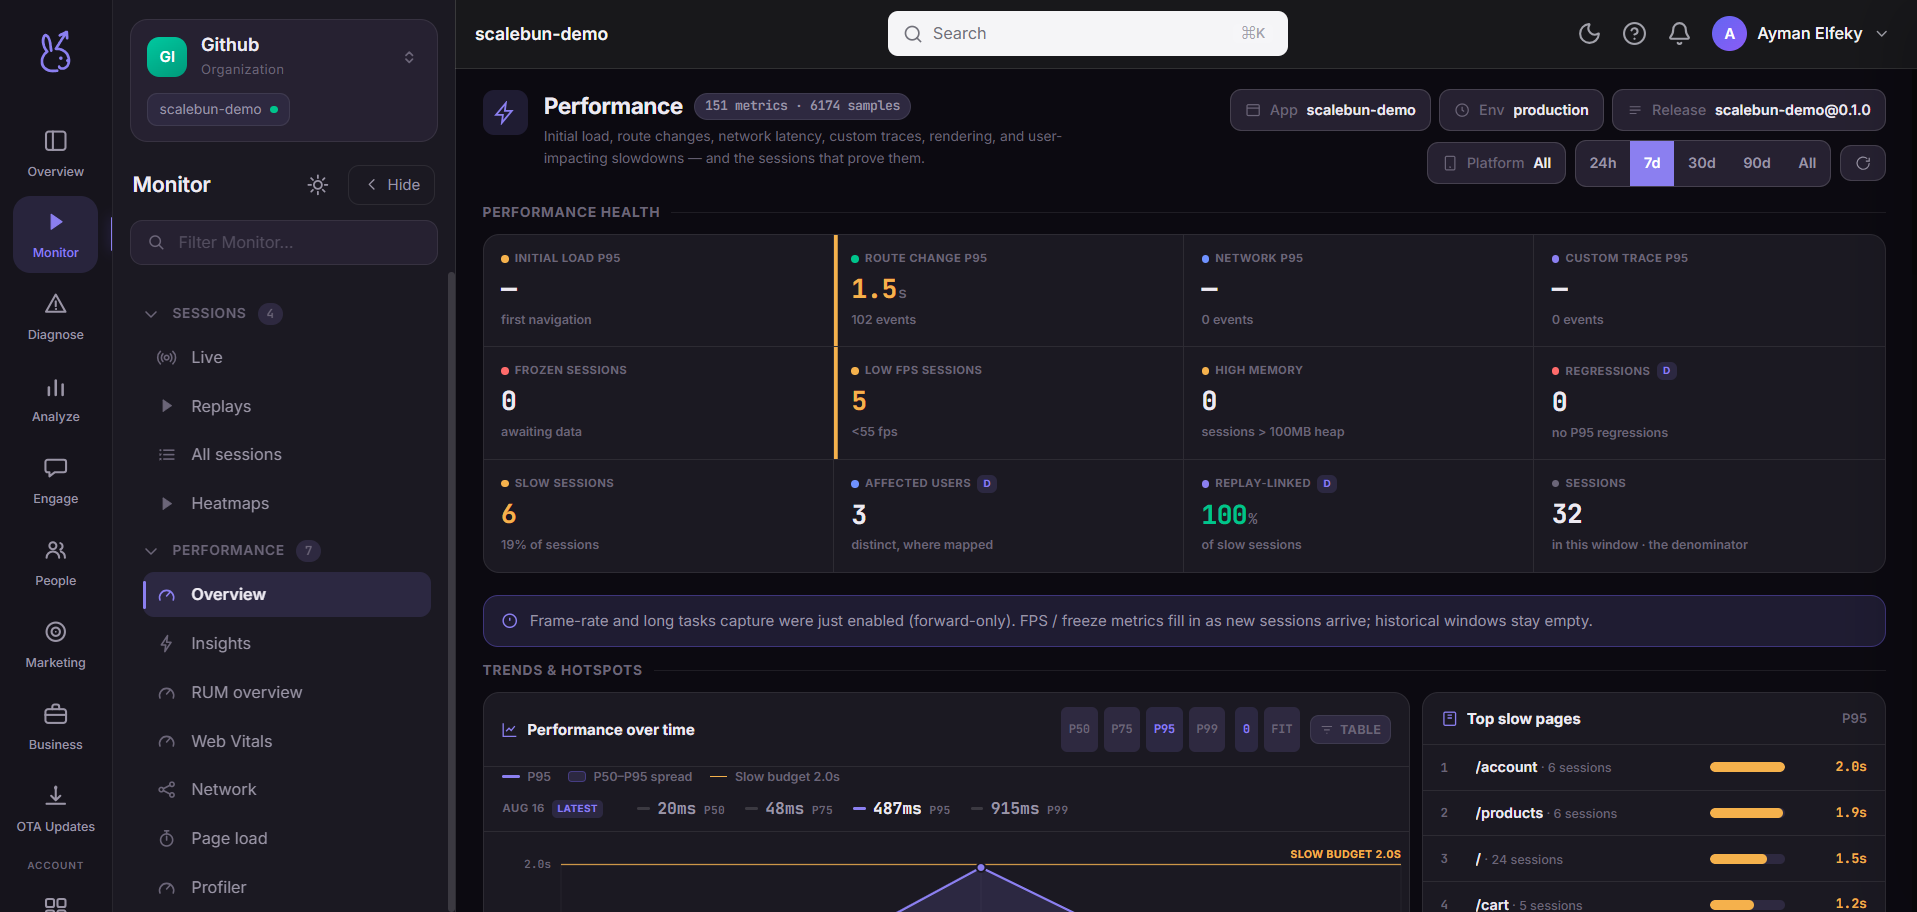
The Monitor area of the ScaleBun dashboard.
Monitor answers what is happening and how fast. It is the area for observed behaviour and timing, as distinct from failures — those live in Diagnose.
Two halves#
Sessions is the qualitative half: live sessions, replays, the full session list and heatmaps. Use it when you need to see what a user actually did.
Performance is the quantitative half: app start, screen load, network, and — for web apps — RUM, Web Vitals, traces, resources, jank and the profiler. Use it when you need a distribution rather than an anecdote.
The two are meant to be used together. A p95 screen-load regression tells you something got slower; a replay of a session in that bucket usually tells you why.
Platform gating#
Several Performance pages are platform-specific and hide for apps they do not apply to: App start and Screen load are mobile concepts, while RUM, Web Vitals, Page load, Traces, Resources, Jank and Profiler are web-only. A page missing from your sidebar is gating, not a permission problem.
Related#
Session replay SDK guide — what gets captured, and masking.
Performance SDK guide — the tiered collector model.
Sessions#
| Page | Route | Platforms |
|---|---|---|
| Live | /monitor/live | All |
| Replays | /monitor/replays | All |
| All sessions | /monitor/all-sessions | All |
| Heatmaps | /experience/heatmaps | All |
Performance#
| Page | Route | Platforms |
|---|---|---|
| Overview | /monitor/overview | All |
| Insights | /monitor/insights | All |
| App start | /monitor/app-start | Mobile only |
| RUM overview | /monitor/rum | Web only |
| Web Vitals | /monitor/web-vitals | Web only |
| Network | /monitor/network | All |
| Screen load | /monitor/screen-load | Mobile only |
| Page load | /monitor/page-load | Web only |
| Profiler | /monitor/profiler | Web only |