Insights
Insights in the Monitor area (Performance) — route /monitor/insights.
Insights lives in the Monitor area of the dashboard, under Performance.
At a glance#
| Dashboard route | /monitor/insights |
| Area | Monitor (monitor) |
| Group | Performance |
| Platforms | Available for every app platform. |
What it does#
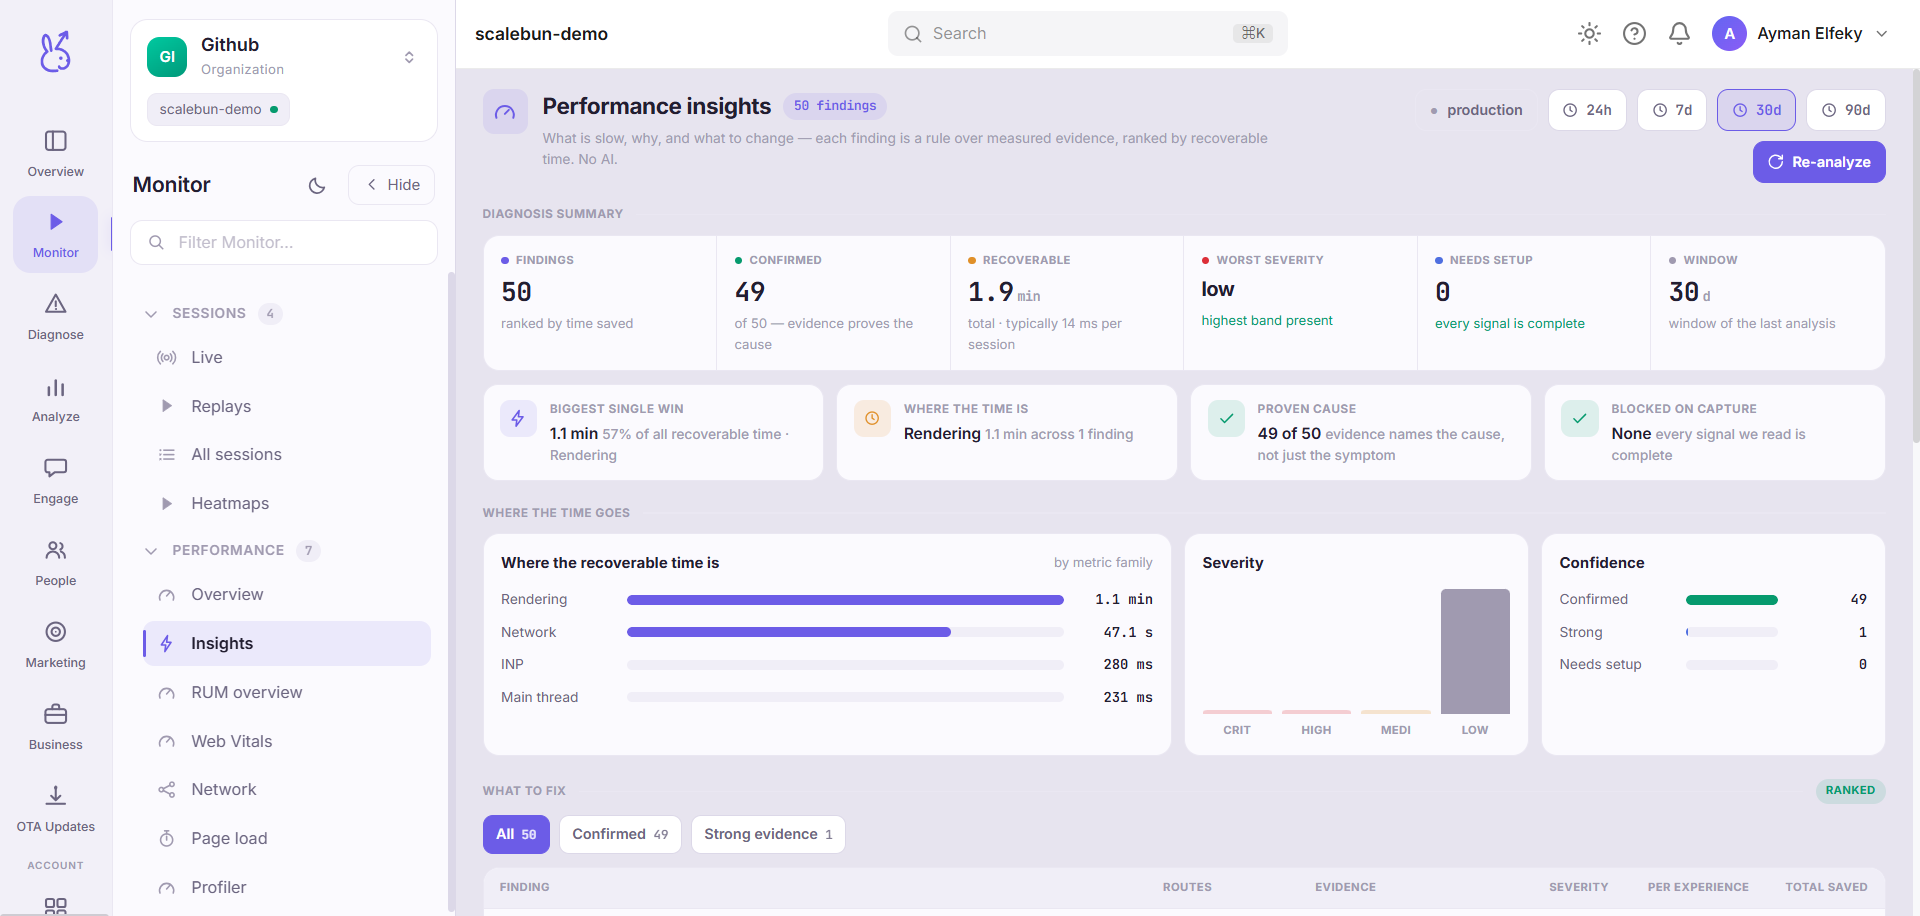
Insights is the one Monitor page that interprets rather than plots. Every other page here shows you measurements; Insights reads those measurements and tells you what is wrong, how confident it is, and what to change. Each finding is a deterministic rule over data you have already captured — not a model, not a guess — and findings are ranked by the amount of user-facing time fixing them would recover, so the top of the list is always the biggest win.
Reading the page#
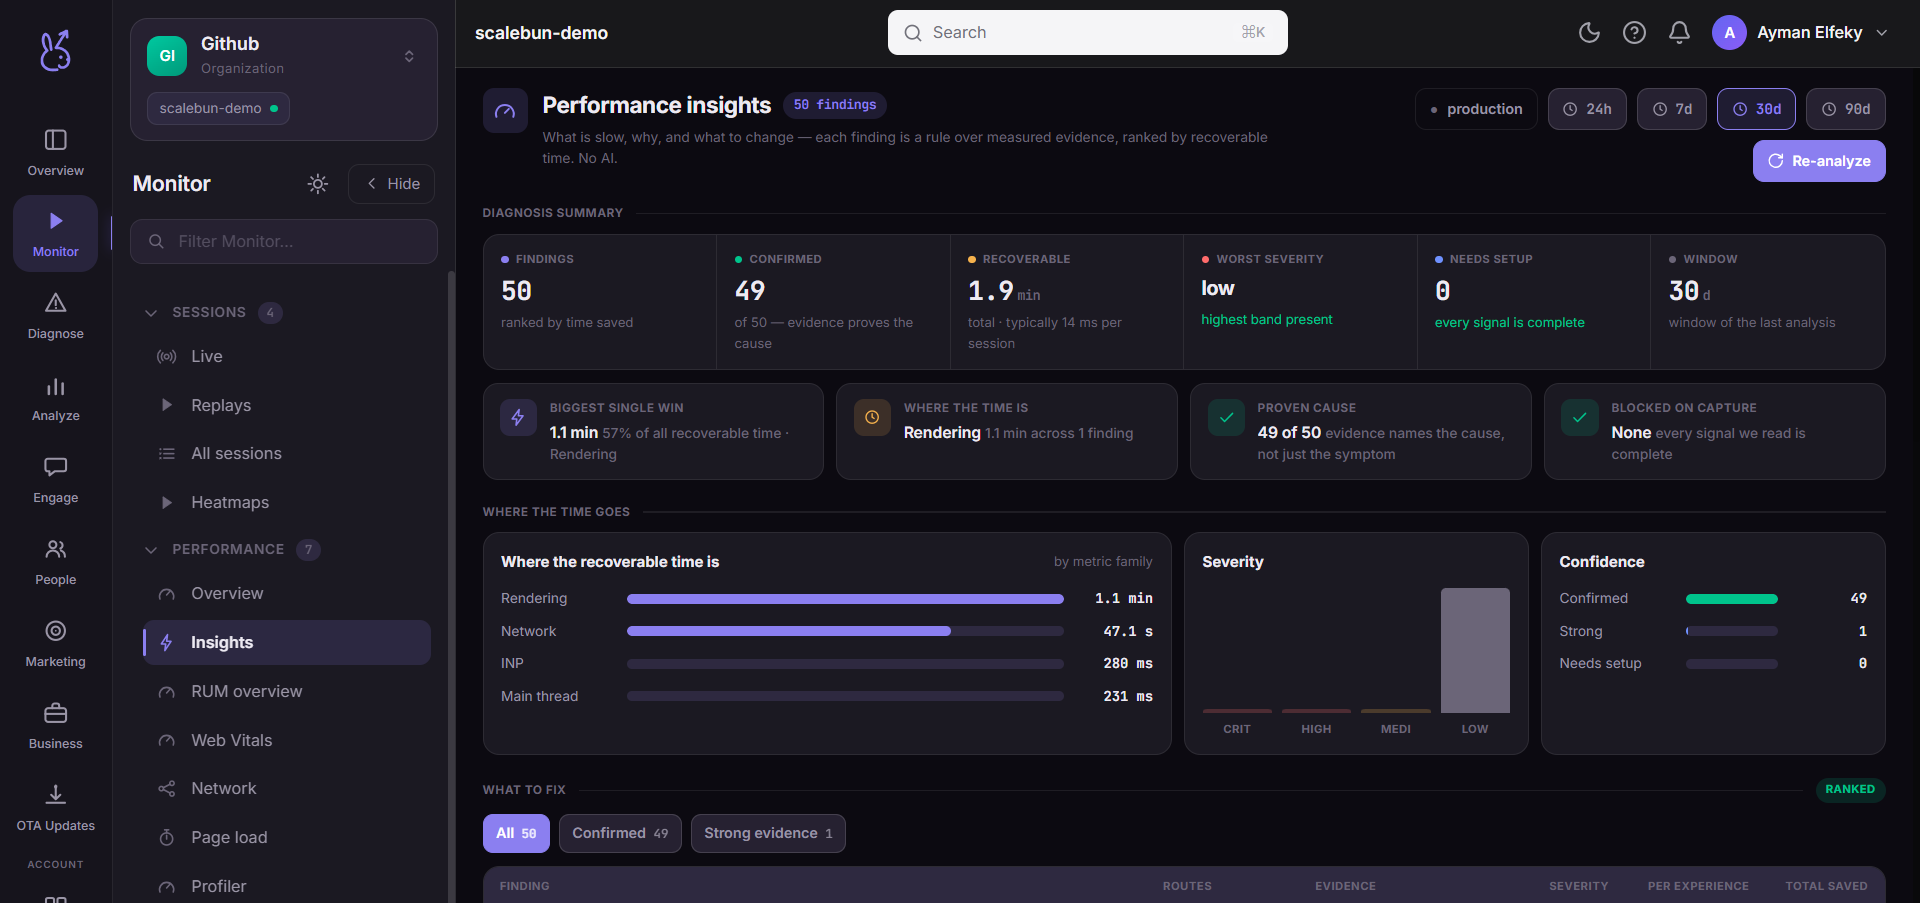
Diagnosis summary — a compact scoreboard: how many findings there are, how many are confirmed, the total recoverable time (and the typical amount per session), the worst severity present, how many findings are blocked on missing setup, and the window analysed.
Where the time goes — three views of the same set: recoverable time broken down by metric family, the spread of severities, and the spread of confidence levels.
What to fix — the findings themselves, filterable to confirmed, strong-evidence, critical or high. Each row names the problem, its subject (a route, an origin, or a resource), the evidence behind it, its severity, and two separate costs: the time per experience and the total time across the fleet — kept apart on purpose so a large fleet total does not read as one slow page.
Needs setup — signals that are recording events but not yet the measurements a diagnosis requires, so you know what to instrument to unlock more findings.
What it diagnoses#
Findings cover the web performance families — LCP, INP, CLS, TTFB, network, main-thread and rendering — and the mobile ones — app launch, screen load, UI hangs and JS stalls — plus memory. Because the rules run over stored metrics, opening the page never re-analyses; picking a window or choosing re-analyse is what triggers a run.
Confidence and severity#
Every finding carries a confidence — confirmed, strong, or insufficient — and a severity from low to critical. Confidence is about the evidence (do we have enough sessions to be sure), severity is about the impact. Start with confirmed-critical and work down.
How it differs from the rest of Monitor#
Overview, RUM and Web Vitals present numbers for you to interpret. Insights is the layer above them: it applies rules to those numbers and hands you a ranked, evidence-backed, fixable list. Use the plotting pages to explore a metric; use Insights to decide what to do first.
Where the data comes from#
From the SDK
Served by
Perf Autopilot