Heatmaps
Heatmaps in the Monitor area (Sessions) — route /experience/heatmaps.
Heatmaps lives in the Monitor area of the dashboard, under Sessions.
At a glance#
| Dashboard route | /experience/heatmaps |
| Area | Monitor (monitor) |
| Group | Sessions |
| Platforms | Available for every app platform. |
| Note | This entry points outside its area's usual /{area}/{slug} pattern. |
What it does#
Heatmaps show where people click and tap. The page is three panes: a route explorer listing every route template discovered from your traffic, a viewer rendering positional click density for the selected route, and a stats panel with the top hotspots. Selecting a hotspot opens detail on that specific area.
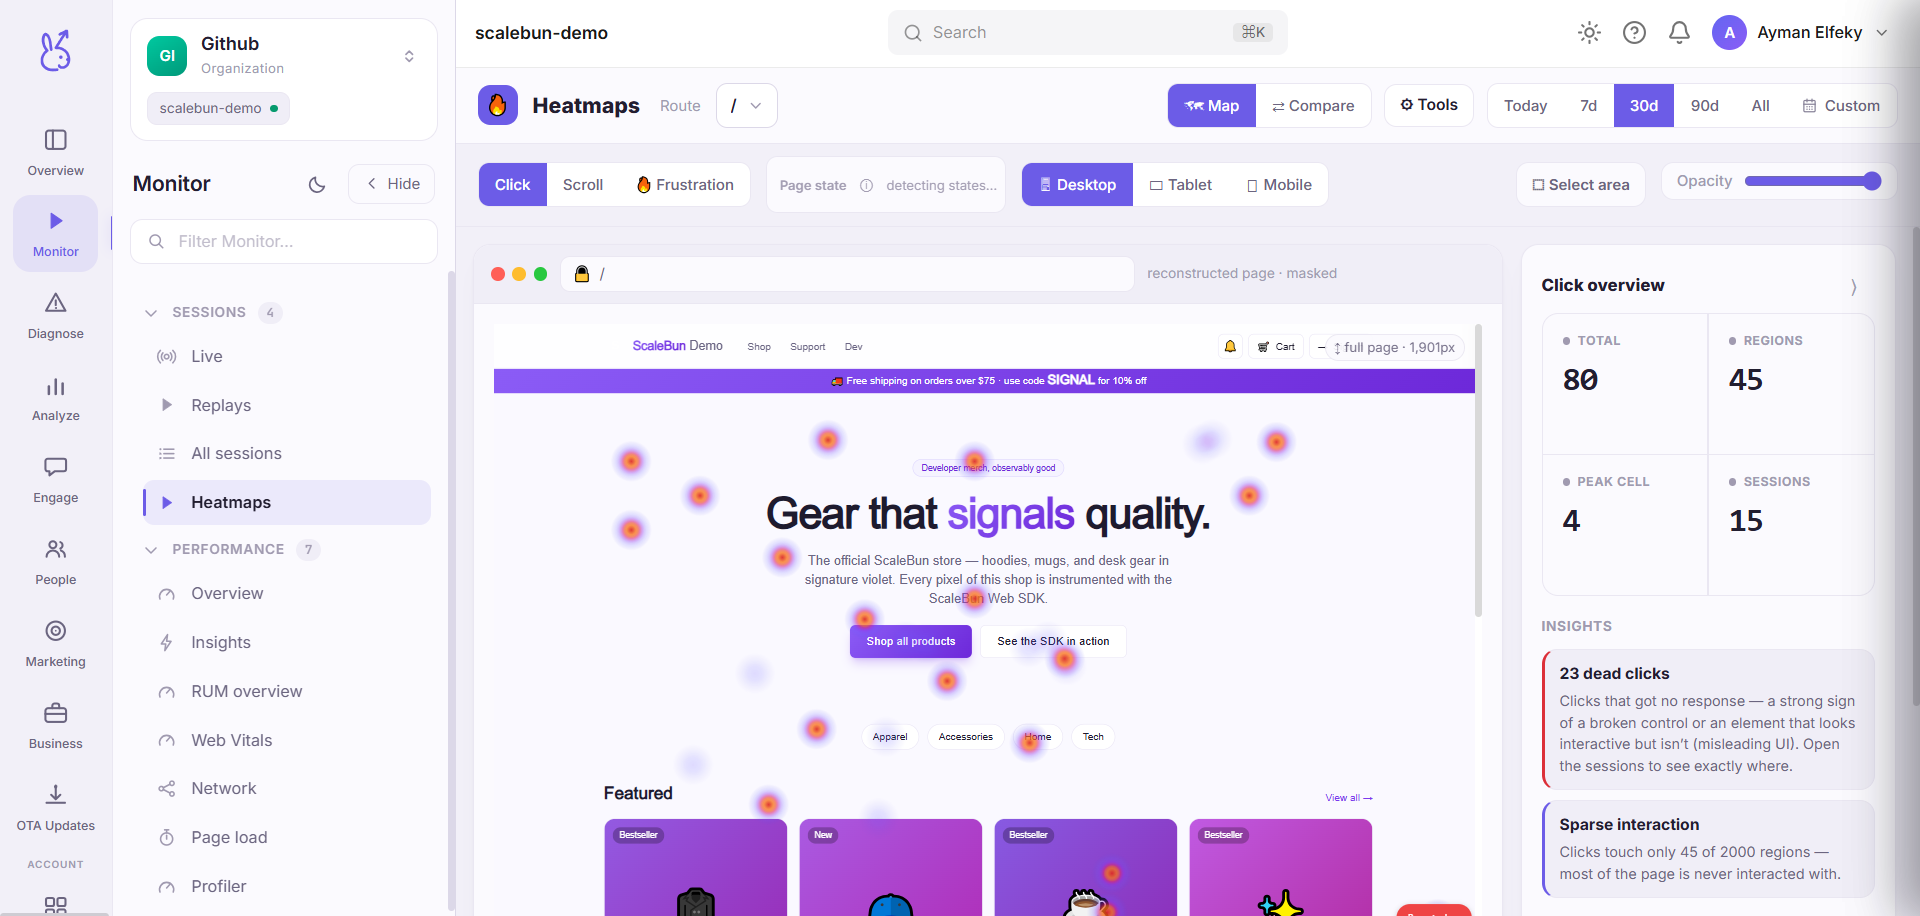
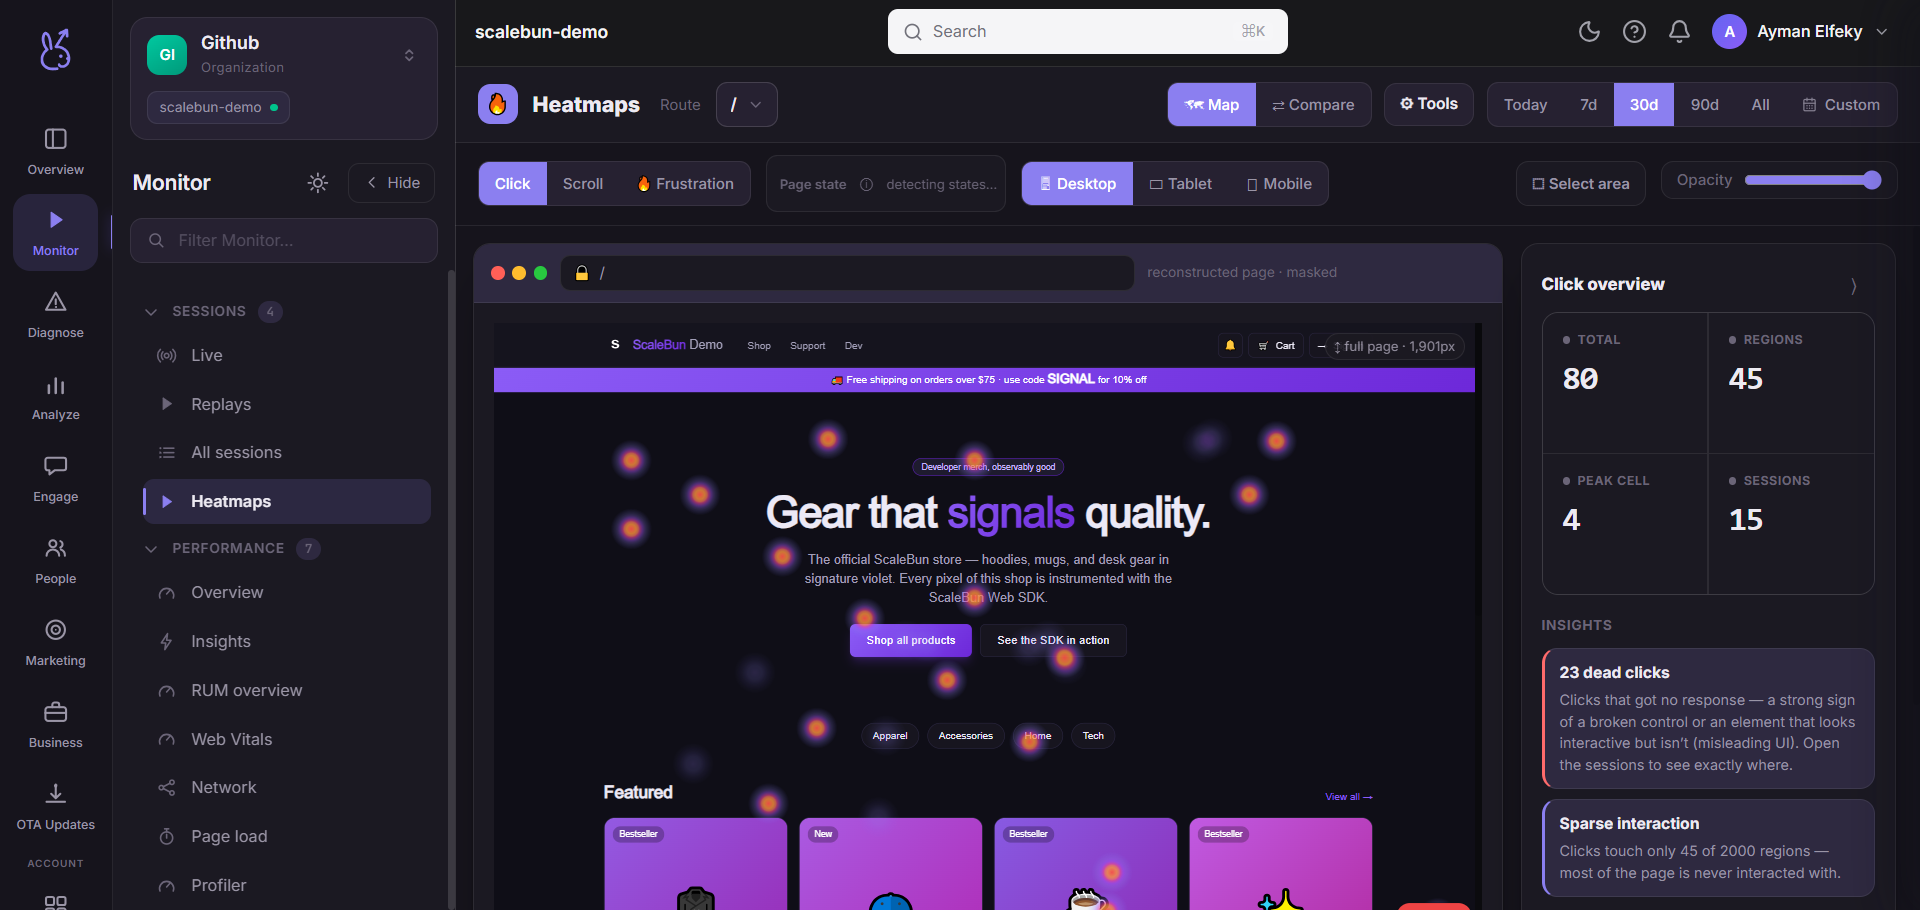
Density is drawn on a grid with a colour ramp and a legend, over a neutral device or browser frame.
Routes are grouped by template, so /product/:id is one heatmap rather than ten thousand.
When to use it#
When you want to know what people tried, not what they achieved. Two findings come up repeatedly and neither is visible in event analytics:
Clicks on things that are not interactive. People clicking a static price, a product image, or a heading is a design signal — they expected something to happen there.
A prominent element nobody touches. A call to action with no density is being seen and ignored, which is a very different problem from not being found.
Workflow#
Pick a route with real volume
Positional density needs samples. A route with fifty visits produces a heatmap that reflects fifty individuals, not a pattern.
Look for density away from controls
Clicks on non-interactive elements are the highest-value finding here and the easiest to miss, because you know what is clickable and your users do not.
Open the top hotspots
The stats panel ranks them, so you do not have to judge intensity by eye — which people are reliably bad at.
Confirm with a replay
A hotspot tells you where; a session replay tells you what happened next. Repeated clicks in one spot usually mean something did not respond.
Permissions and prerequisites#
Available on every platform. Requires interaction capture in the SDK.
Limits and edge cases#
Positions are viewport-relative. Responsive layouts move elements between screen sizes, so density from very different viewports overlaps imperfectly.
Route templates come from observed traffic. A route nobody visited in the window will not be in the explorer.
Density shows attention, not success. A hot button might be hot because it works or because it needed three attempts.
Troubleshooting#
A route is missing from the explorer. No traffic in the selected window, or the route resolves to a template you are not expecting. Widen the window first.
Density is concentrated in one corner. Usually a fixed-position element — a chat widget or a cookie banner — collecting clicks. Real, and rarely what you were looking for.
Where the data comes from#
Served by
Heatmaps