Web Vitals
Web Vitals in the Monitor area (Performance) — route /monitor/web-vitals.
Web Vitals lives in the Monitor area of the dashboard, under Performance.
At a glance#
| Dashboard route | /monitor/web-vitals |
| Area | Monitor (monitor) |
| Group | Performance |
| Platforms | Web apps only. Hidden for mobile apps. |
What it does#
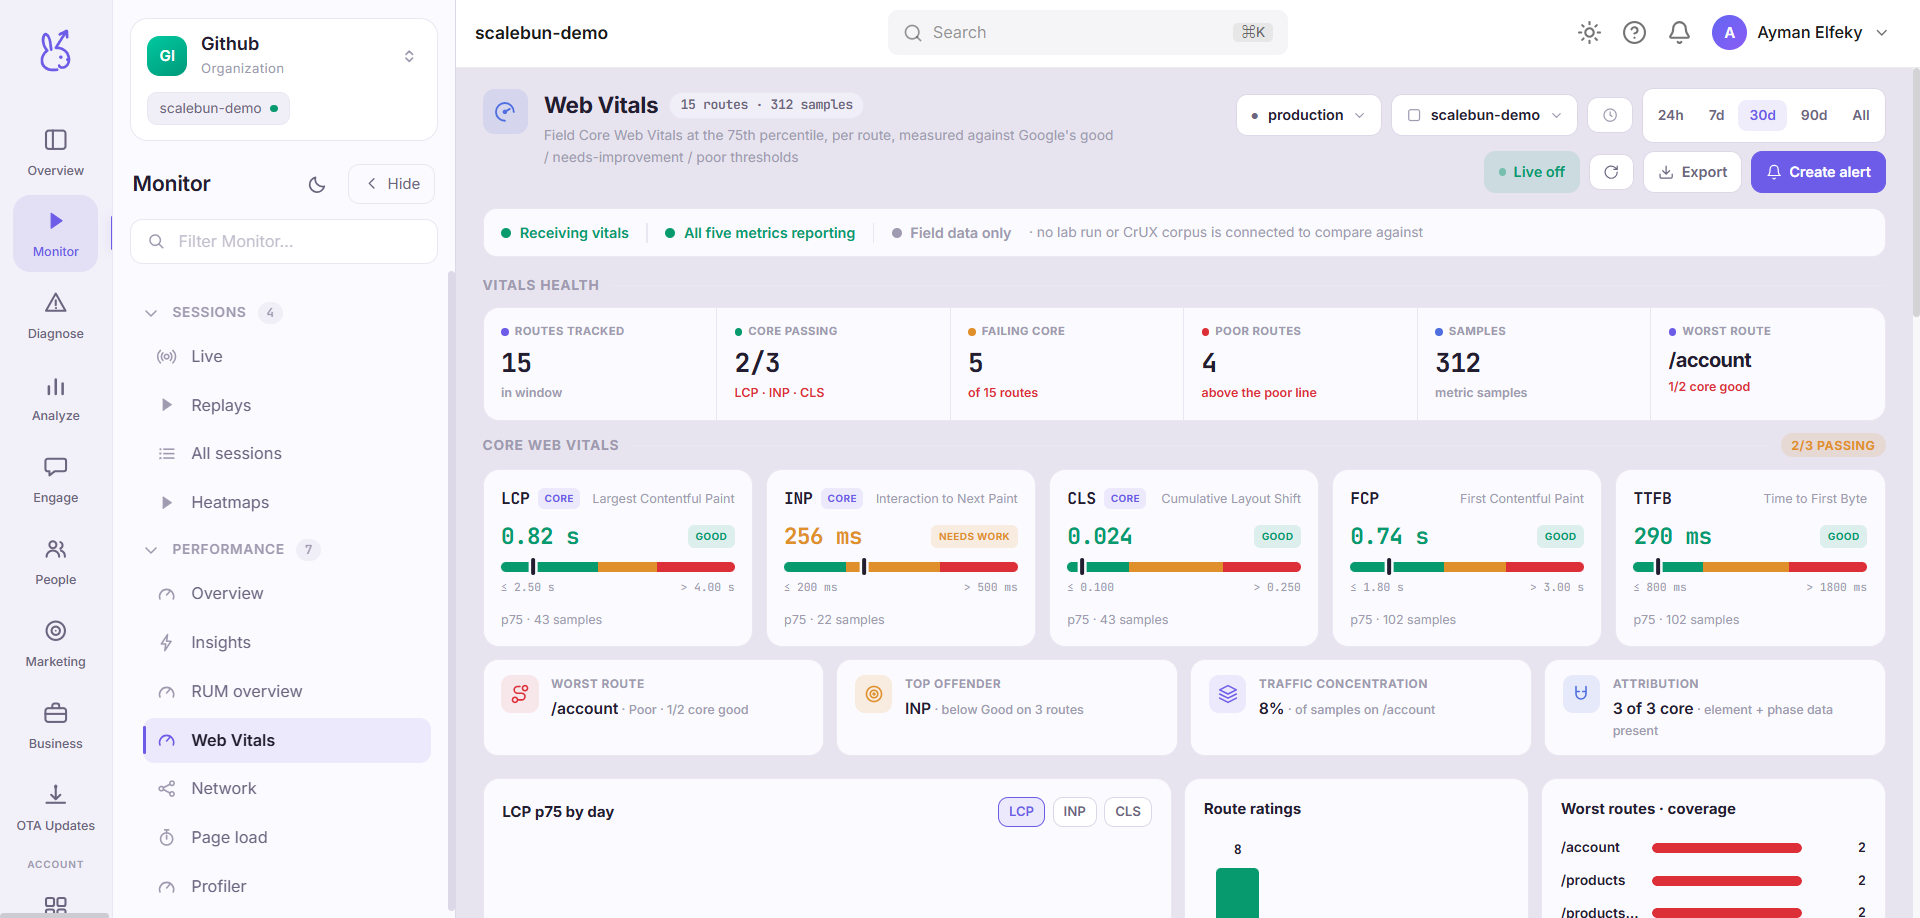
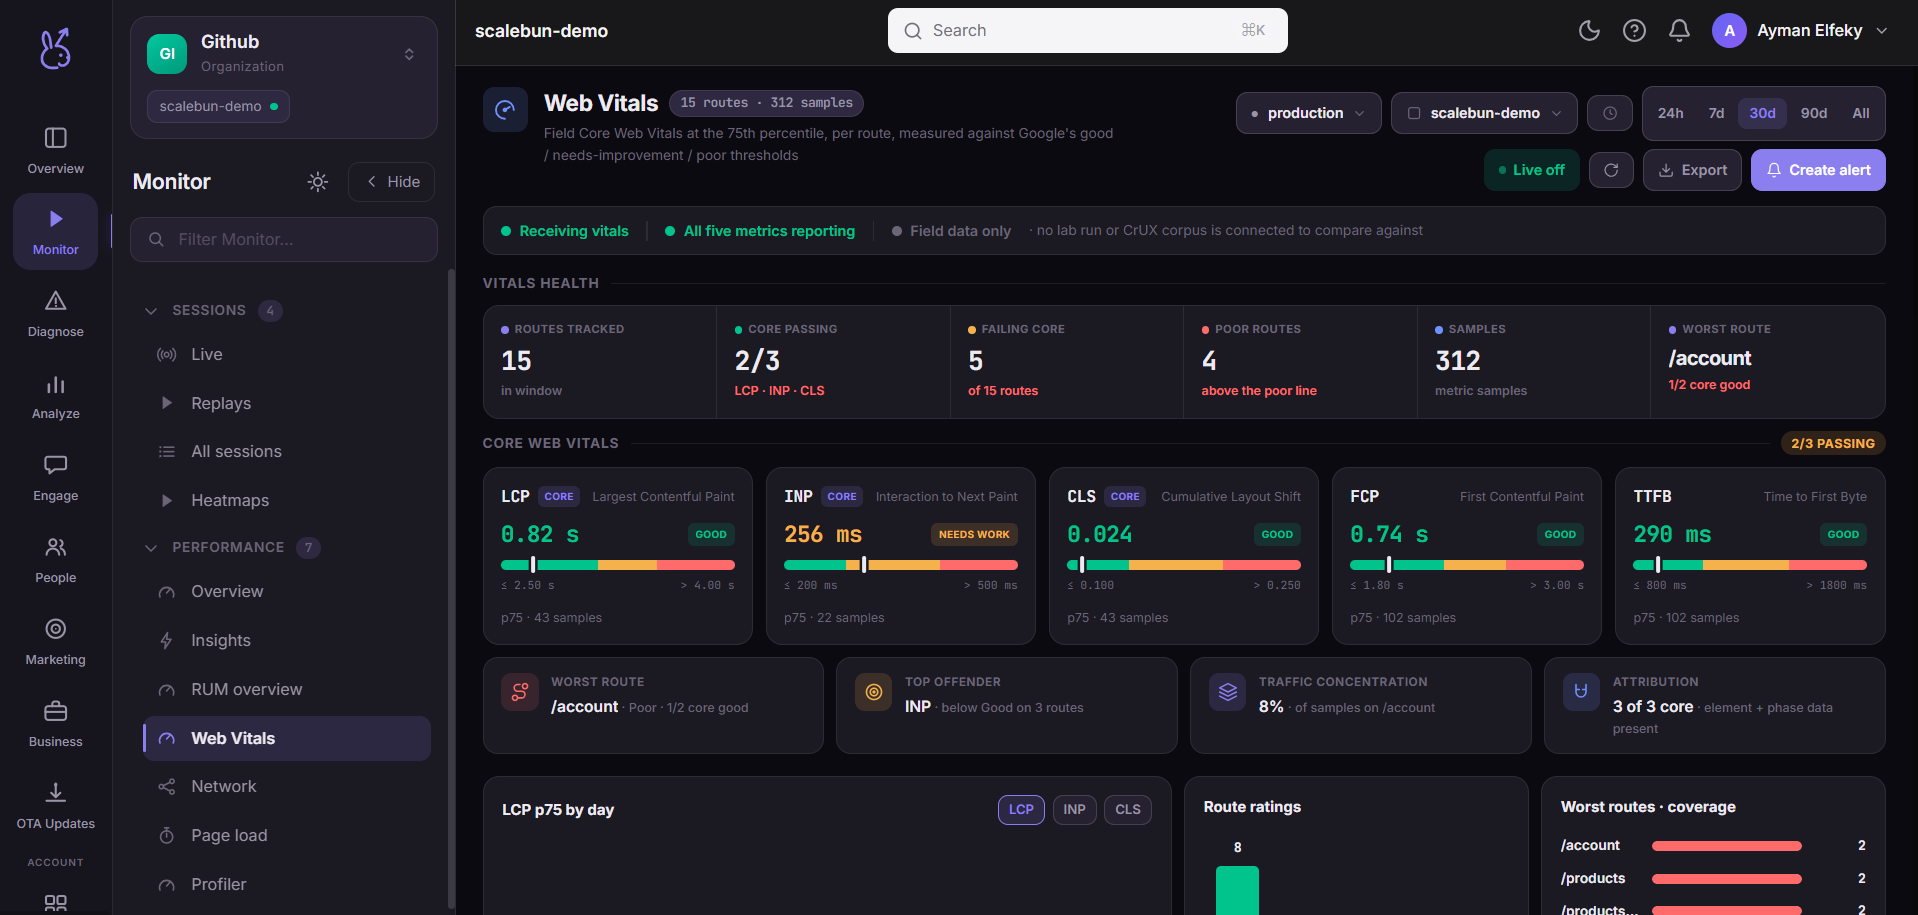
Web Vitals reports the Core Web Vitals at the 75th percentile against the published web.dev thresholds, each as a gauge with good / needs-improvement / poor zones and a marker at your p75:
| Metric | Good | Needs improvement |
|---|---|---|
| Largest Contentful Paint (LCP) | ≤ 2.50 s | ≤ 4.00 s |
| Interaction to Next Paint (INP) | ≤ 200 ms | ≤ 500 ms |
| Cumulative Layout Shift (CLS) | ≤ 0.10 | ≤ 0.25 |
| First Contentful Paint (FCP) | ≤ 1.80 s | ≤ 3.00 s |
| Time to First Byte (TTFB) | ≤ 800 ms | ≤ 1.80 s |
LCP, INP and CLS are the three Core vitals; FCP and TTFB are supporting metrics that help explain the others rather than being goals themselves. Below the gauges, a "what to fix" panel turns the SDK's attribution data into a phase breakdown, and you can jump from a poor bucket to the actual sessions behind it.
When to use it#
Continuously — these are the metrics search ranking uses, so they have consequences beyond user experience. Also any time you ship a change to layout, fonts, images, or third-party scripts, because all four move CLS and LCP more than people expect.
Workflow#
Fix poor before improving good
The threshold zones are the priority order. Moving a poor metric into needs-improvement is worth more than polishing one already in the green.
Read the attribution panel
LCP tells you the largest element was slow; attribution tells you whether the time went to TTFB, resource load, or render delay. Those are three unrelated fixes and only one of them is yours to make.
Watch a slow session
Each poor bucket links through to the sessions in it. A layout shift is much easier to understand watched than described.
Permissions and prerequisites#
Web apps only — hidden for mobile, which has no equivalent standard. Mobile analogues are App start, Screen load and ANRs.
Limits and edge cases#
INP and CLS accumulate over the visit. They are not measured at load, so a page a user leaves immediately reports neither. Low sample counts on those two are normal.
Thresholds are absolute, not relative to you. They do not adapt to your industry or your users' devices, which is what makes them comparable.
A p75 on a small window is unstable. Widen the window until the marker stops moving day to day before you draw a conclusion.
Troubleshooting#
CLS is poor but the page looks stable. Layout shift usually happens before you look — late-loading fonts, images without dimensions, or an injected banner. Watch a session from a poor CLS bucket.
LCP is poor and TTFB is good. The server is fine and the problem is client-side: the largest element is discovered late, loaded late, or blocked on render. The attribution panel will say which.
Metrics missing entirely. Confirm the app platform is web and that Web Vitals reporting is enabled in the SDK.
Where the data comes from#
p75 per metric against the published web.dev thresholds. The attribution panel is built from the SDK’s own performance attribution.
From the SDK
Served by
Dashboard