Profiler
Profiler in the Monitor area (Performance) — route /monitor/profiler.
Profiler lives in the Monitor area of the dashboard, under Performance.
At a glance#
| Dashboard route | /monitor/profiler |
| Area | Monitor (monitor) |
| Group | Performance |
| Platforms | Web apps only. Hidden for mobile apps. |
What it does#
The Profiler lists JS self-profiling traces captured from real user sessions and, for the selected trace, aggregates it into a hotspot table — self time and total time per function. Each trace records the session, screen, duration and sample count.
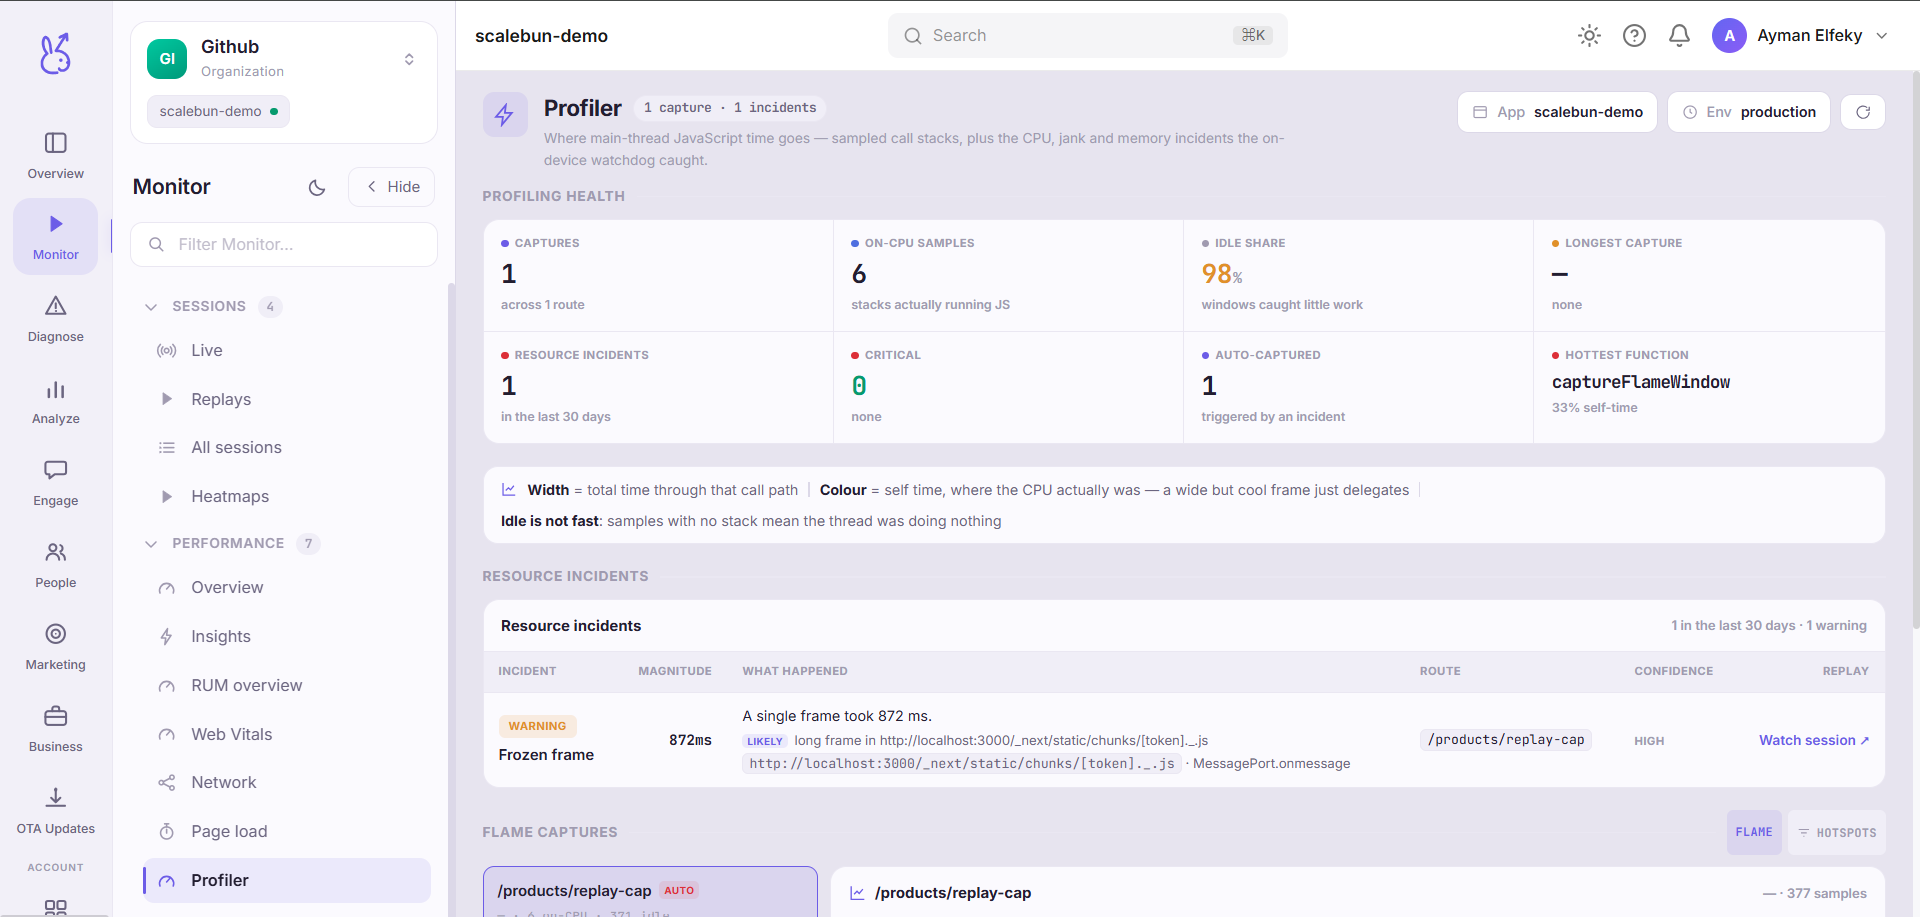
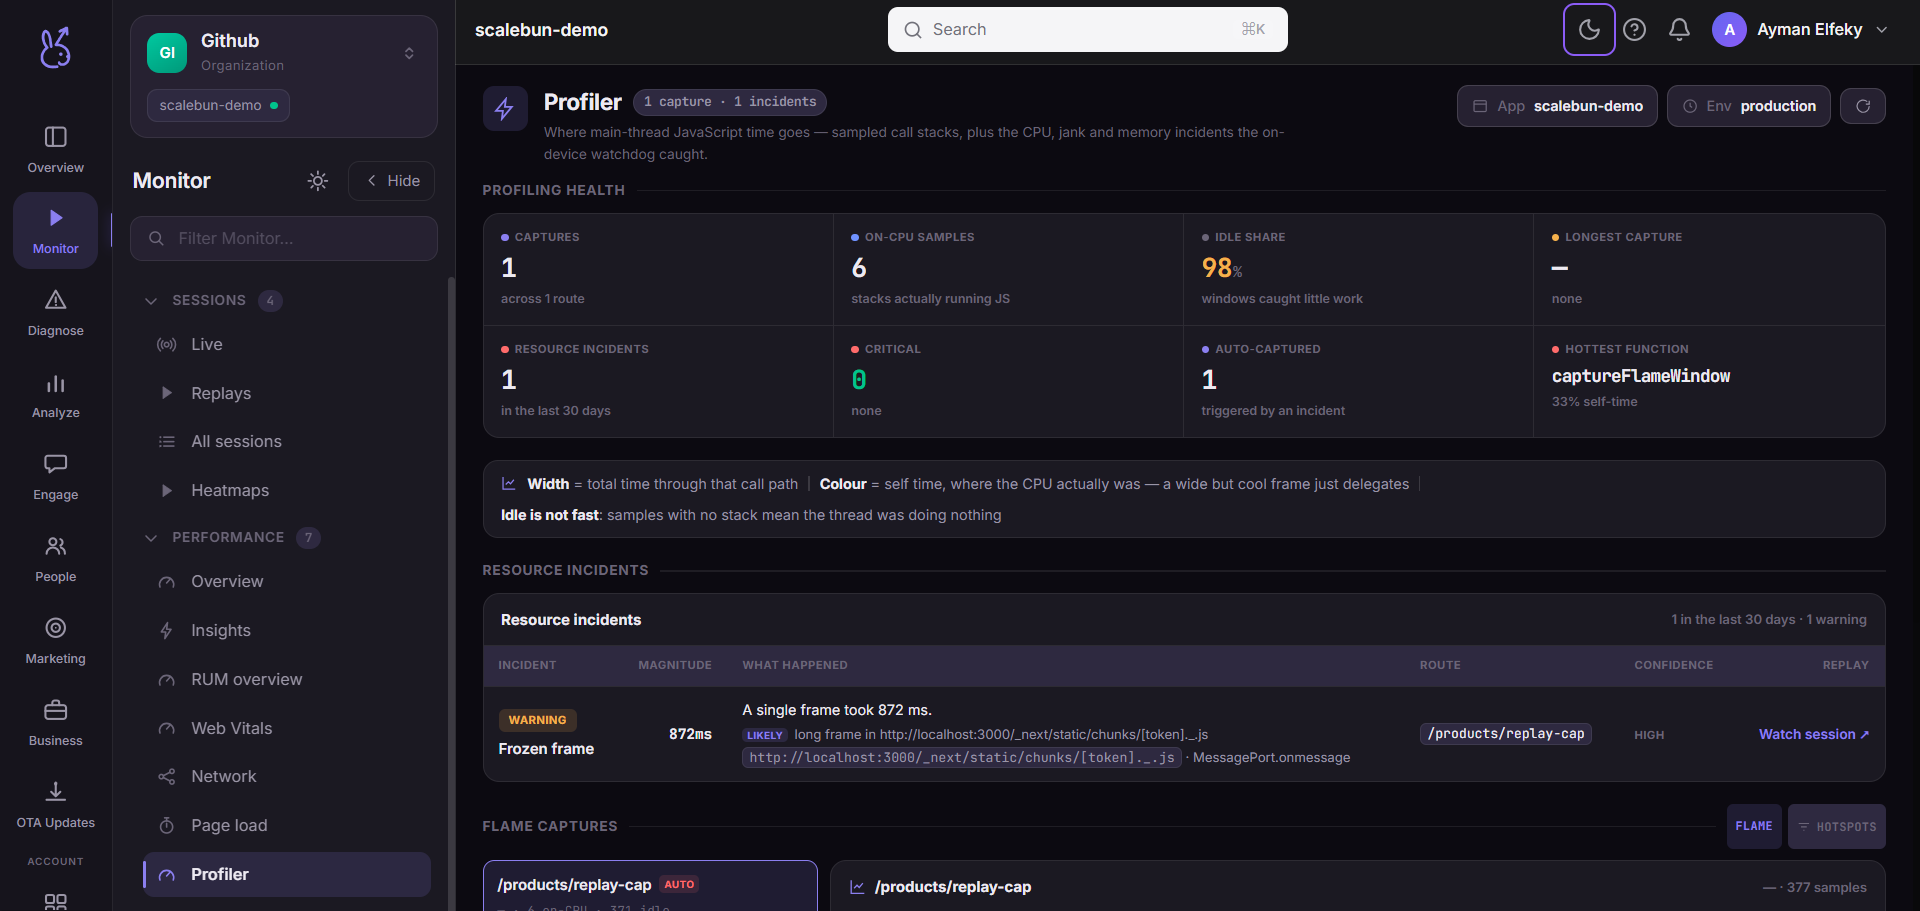
This is the deepest view in Monitor. Jank tells you which script blocked; the profiler tells you which function, sampled on a real user's device rather than yours.
When to use it#
Last. When you know a screen is slow, you know roughly where, and the remaining question is which function to change. Reaching for a profiler before you have narrowed the problem produces a lot of data and no decision.
Workflow#
Pick a trace from a slow screen
Duration and screen name are on each row. A trace from a fast session teaches you nothing.
Sort hotspots by self time
Self time is where the CPU actually was. Total time includes everything a function called, so it will rank your entry point first and tell you nothing.
Cross-check against sample count
A profile with few samples is a short observation window. Treat single-sample frames as noise.
Permissions and prerequisites#
Web apps only, and only in browsers that implement JS self-profiling. Combined with the header requirement, expect this to cover a subset of your traffic rather than all of it — which is fine for profiling, where you need representative traces rather than complete coverage.
Limits and edge cases#
Sampling, not tracing. The profiler observes at an interval, so it reliably finds hot functions and reliably misses fast infrequent ones.
Function names depend on your build. Minified output produces minified frames. Ship source maps if you want readable hotspots.
Not available on mobile. There is no equivalent capture, and this route is hidden for mobile apps rather than shown empty.
Troubleshooting#
No traces at all. Check the Document-Policy: js-profiling header on the document response, in
production, on the origin your users actually hit — a header set in local dev proves nothing.
Hotspots are all single letters. That is minified code. Frames are accurate; only the names are lost.
Where the data comes from#
Capture requires the document to be served with Document-Policy: js-profiling — a server or CDN header, not an SDK setting.
From the SDK
Served by
Dashboard