Network
Network in the Monitor area (Performance) — route /monitor/network.
Network lives in the Monitor area of the dashboard, under Performance.
At a glance#
| Dashboard route | /monitor/network |
| Area | Monitor (monitor) |
| Group | Performance |
| Platforms | Available for every app platform. |
What it does#
Network reports your app's outbound API calls: request volume, error rate, latency percentiles and the share of requests classed as slow, then a sortable per-endpoint table, a panel of failed requests, a trend for requests/error-rate/p95, and a per-endpoint drawer. HTTP methods are colour-coded so a table full of writes is visually distinct from a table full of reads.
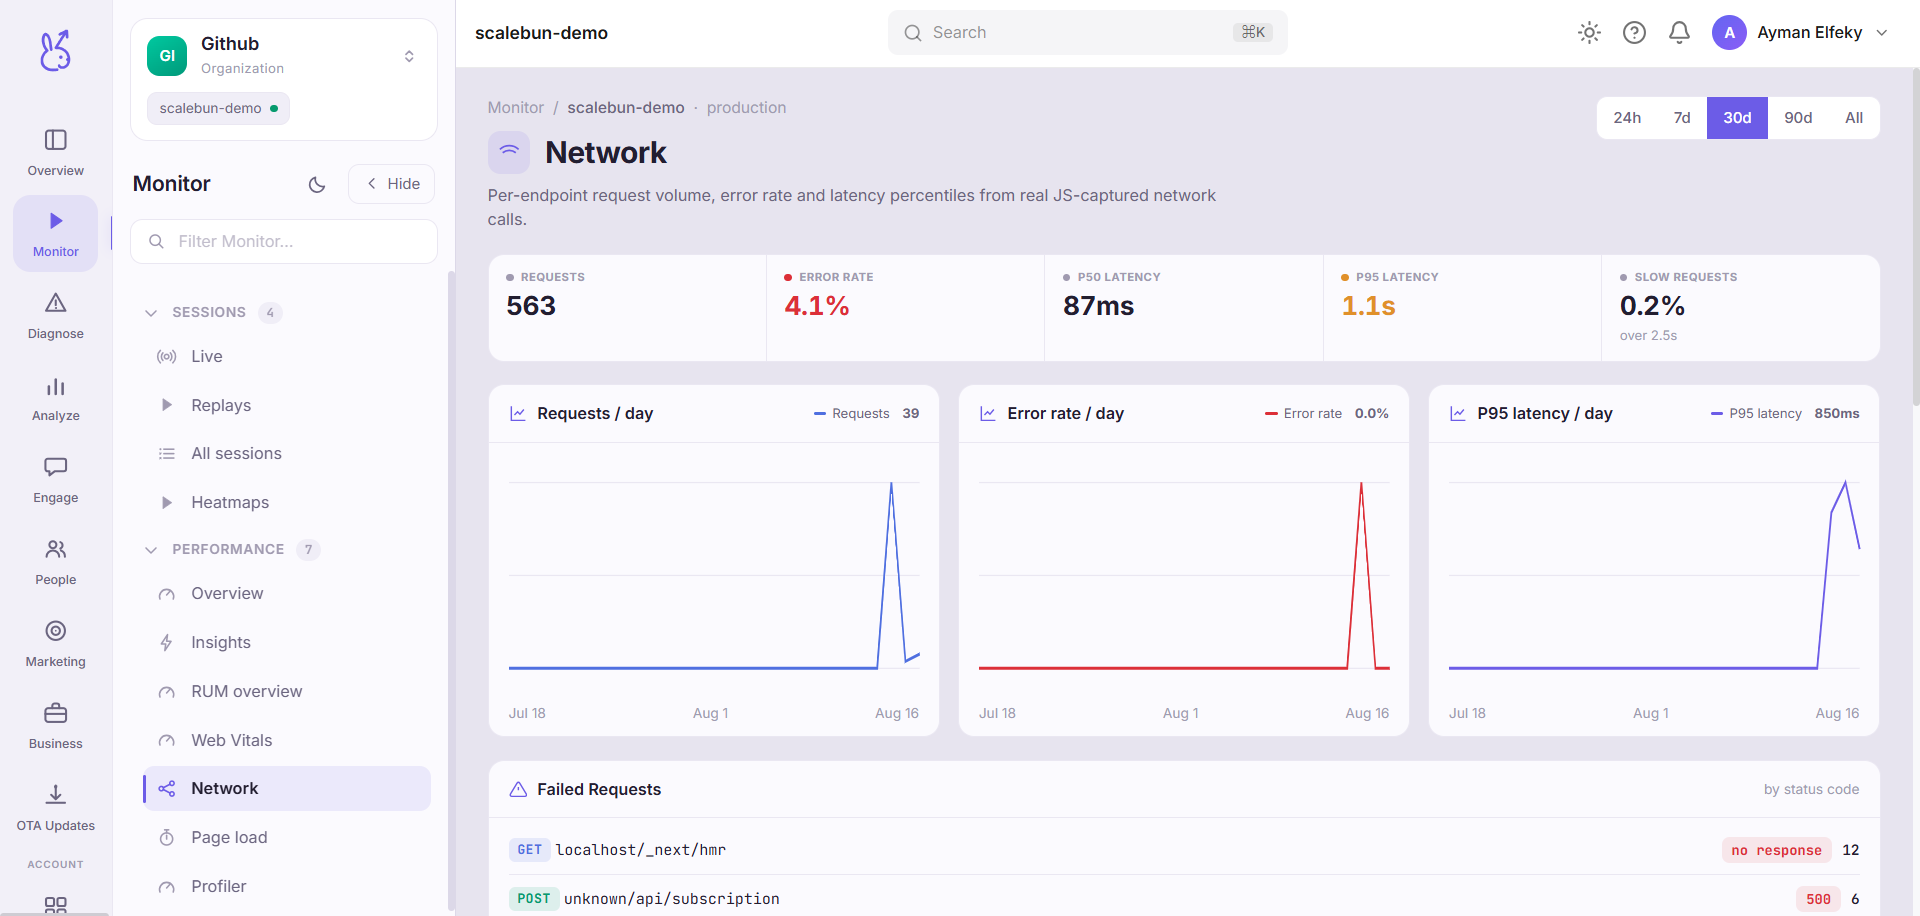
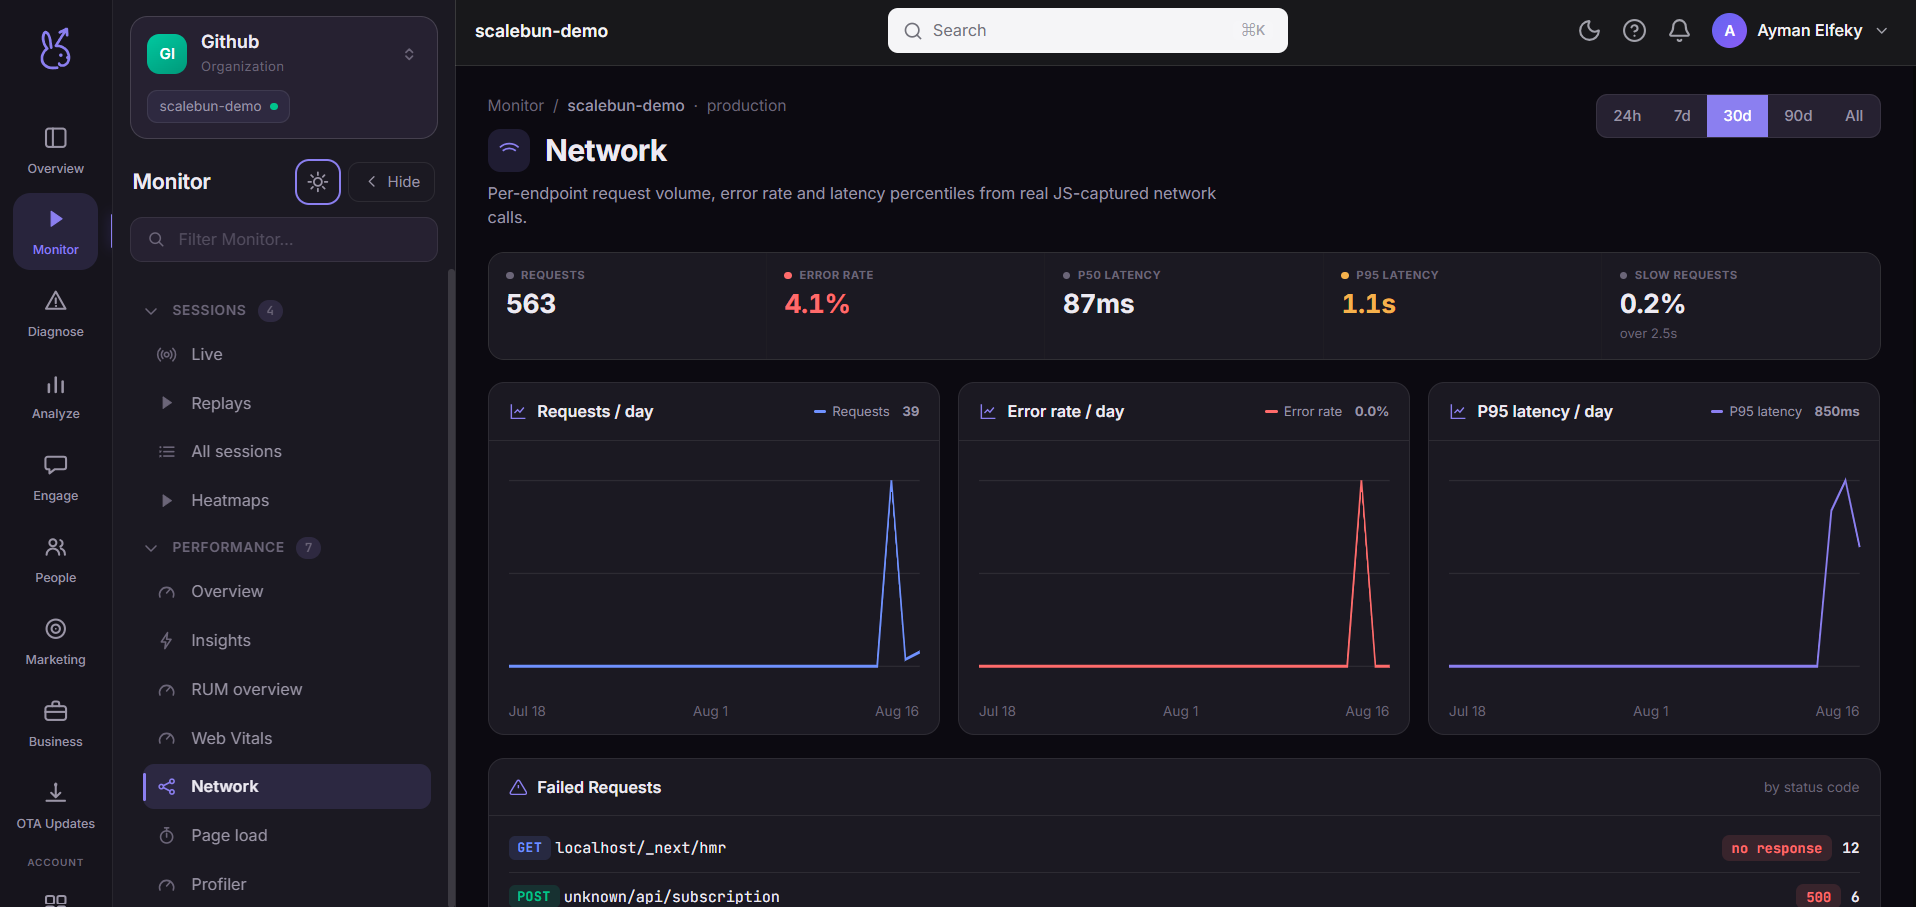
This page is about fetch/XHR calls to APIs. Static assets — images, scripts, stylesheets,
fonts — are a separate concern reported under
Resources on web. The two are deliberately disjoint,
because "our API is slow" and "our images are heavy" have nothing to do with each other.
When to use it#
Whenever the app feels slow and the screen itself is not doing much work. Client-side network data is also the only view that shows what your users experienced rather than what your server logged — it includes DNS, connection setup, the request that timed out before it arrived, and the retry your backend never saw.
Workflow#
Sort by p95, not by average
Averages hide the requests people actually notice. Latency complaints are always about the tail.
Check error rate against the 1% line
The page flags error rate above roughly 1% because that is where a background failure stops being noise. Below it, look at volume before you spend time.
Open the failed-requests panel
Individual failures carry status and timing. A cluster at one status code is a specific bug; a spread across many is usually connectivity.
Open the endpoint drawer to see the breakdown
Per-endpoint detail separates a slow server from a slow connection, which is the difference between a backend ticket and a caching change.
Permissions and prerequisites#
Available on every platform. Requires network instrumentation in the SDK; requests made through a transport the SDK does not wrap will not appear.
Limits and edge cases#
URLs are grouped by endpoint, not by exact path. Ids in paths would otherwise produce unbounded cardinality. If your endpoints are not grouping sensibly, the path template is the thing to fix.
Client-measured, so it includes the network. These numbers will be worse than your server's own timings, and that gap is the point of the page rather than an error in it.
Error rate and slow share are proportions. On a low-volume endpoint a single failure can read as a large percentage. Check the count column.
Nothing here proves the request reached you. A timeout is recorded as a failure with no server-side counterpart.
Troubleshooting#
An endpoint I know is called is missing. It is likely going through an unwrapped client — a native module, a WebSocket, or a third-party SDK with its own transport.
Error rate spiked with no code change. Compare against the failed-request statuses. A jump in
5xx is your backend; a jump in transport-level failures is usually a regional connectivity
event and will resolve itself.
Where the data comes from#
From the SDK
Served by
Analytics