Overview
Overview in the Monitor area (Performance) — route /monitor/overview.
Overview lives in the Monitor area of the dashboard, under Performance.
At a glance#
| Dashboard route | /monitor/overview |
| Area | Monitor (monitor) |
| Group | Performance |
| Platforms | Available for every app platform. |
What it does#
The Performance overview is the front door to everything else in this group. It opens with a single health score and a KPI row, then a trend chart, then ranked "top offender" lists — slowest screens, slowest endpoints, and the app versions and device models carrying the most of the problem. Below that is a filterable table of measurements with a detail drawer per row.
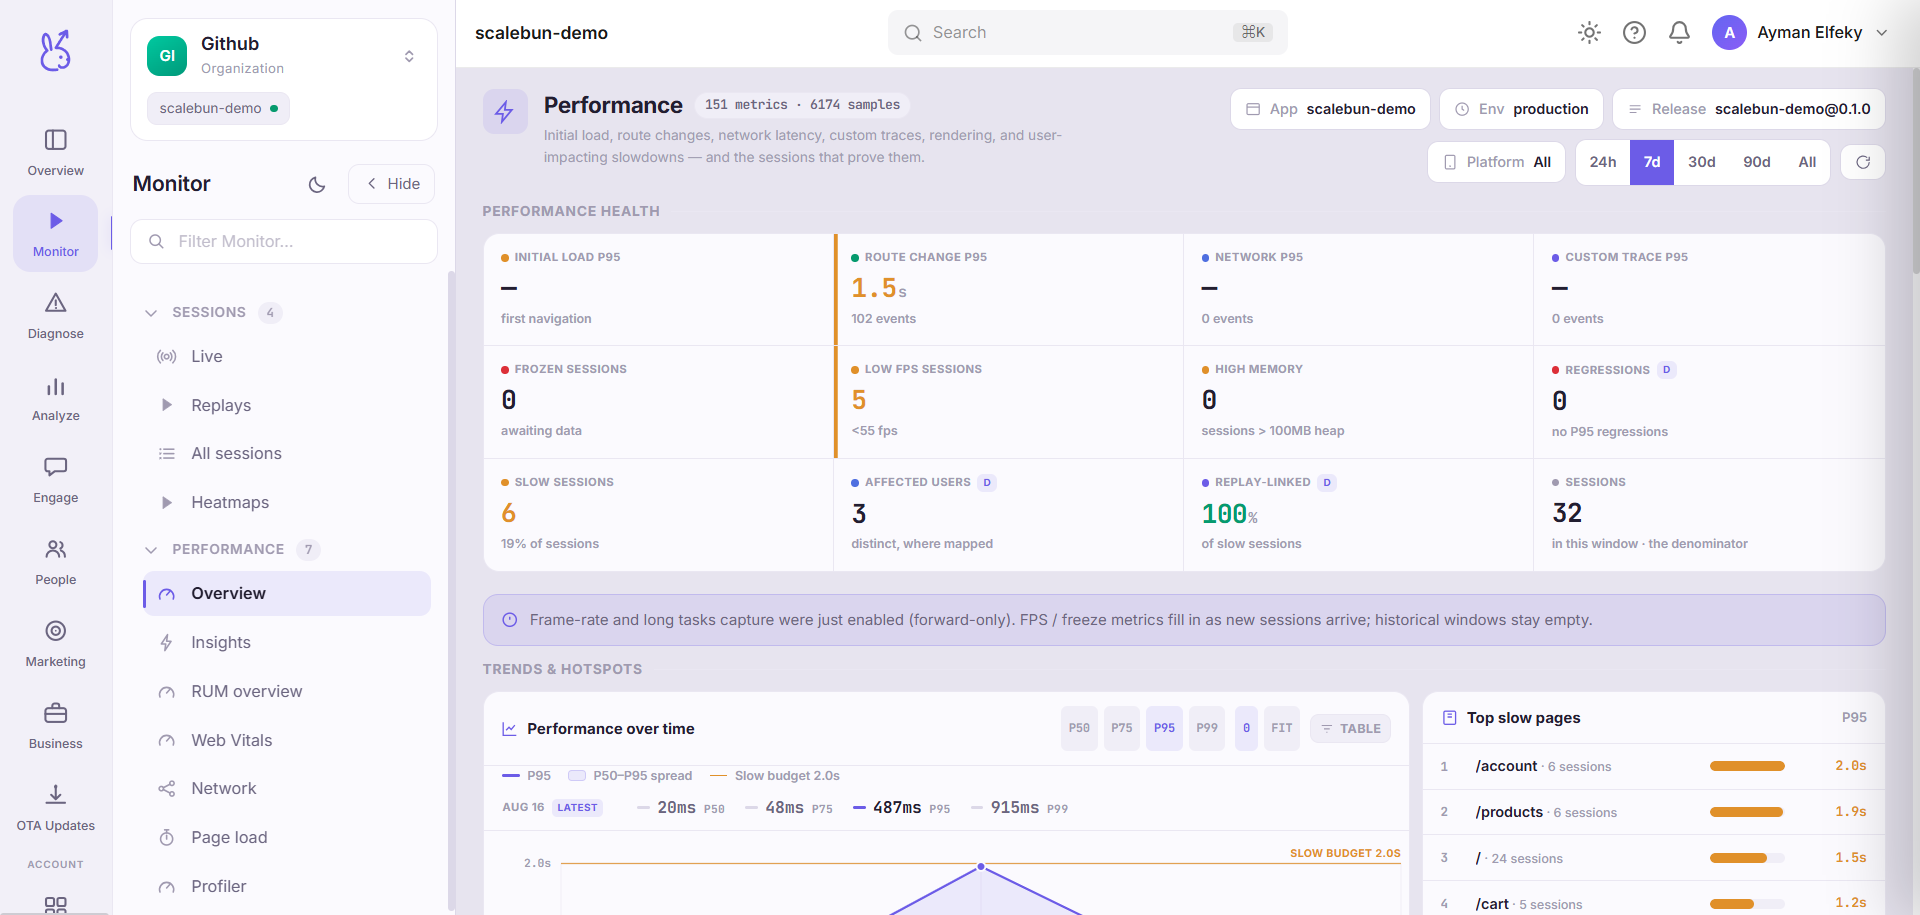
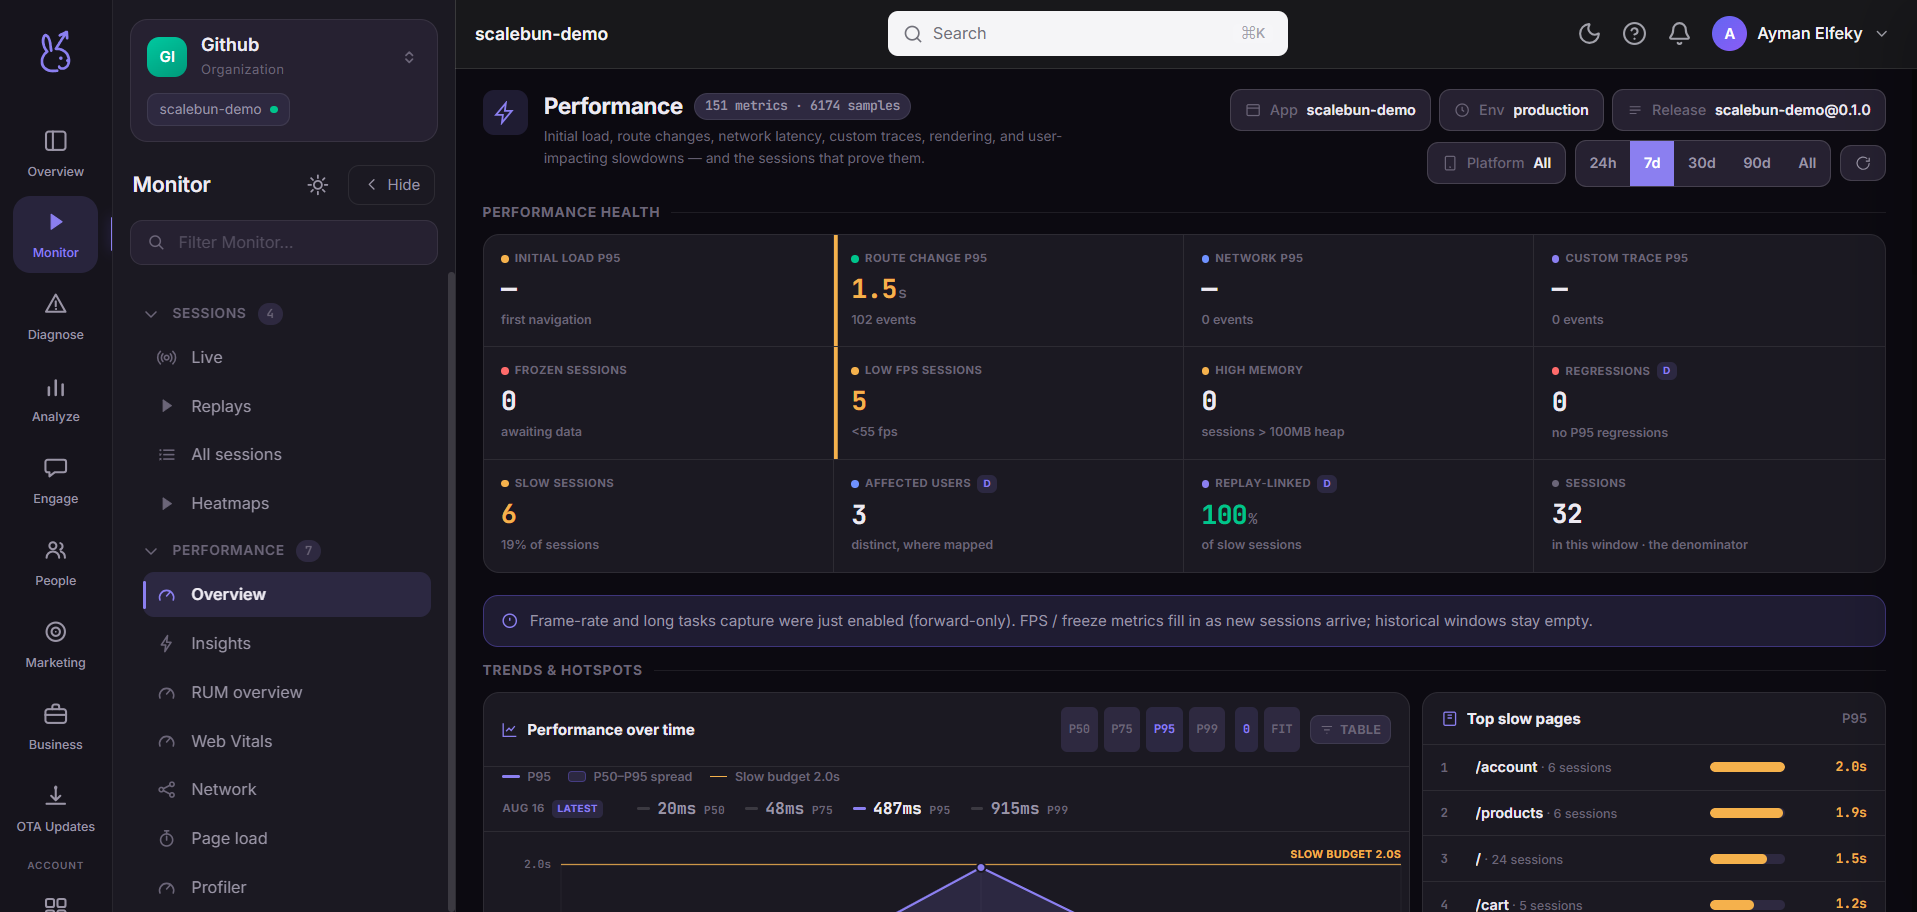
Two numbers on this page are worth knowing about specifically:
Regression count — how many measurements got materially worse over the window, which is a different question from which ones are slowest.
Replay-linked share — what proportion of slow measurements have a session replay attached, and therefore how often you can actually watch a slow experience rather than infer it.
When to use it#
Start here, always. Every other page in this group is one signal in depth; this one tells you which signal to open. Going straight to a specific page means picking the answer before you have looked at the question.
Workflow#
Read the score, then ignore it
The score is a triage signal, not a target. Its only job is to tell you whether to keep reading today.
Check regressions before absolutes
The slowest screen in your app may have been the slowest screen for two years. A screen that got 40% slower last week is the actionable one.
Use the top-version and top-device lists to scope
A problem confined to one app version is a release regression. One confined to a device family is a capability problem. One spread evenly is architectural. These three lists tell you which conversation you are about to have.
Follow the smart view into the specific page
The smart views are pre-built filters onto the cases that usually matter. From there, the per-signal pages have the depth this one deliberately does not.
Permissions and prerequisites#
Requires performance reporting to be enabled in the SDK. Nothing to configure in the dashboard.
Limits and edge cases#
Percentiles need volume. On a low-traffic app or a short window, a p95 is one slow session. Widen the window before you believe a percentile.
The score is composite. It moves for reasons the KPI row may not show individually, so do not report it as a metric to anyone outside the team.
Mobile and web populate different signals. Several pages in this group are gated to one platform, so this overview will reference less on a single-platform app.
Troubleshooting#
The score is present but every list is empty. The window has samples but nothing crossed a reporting threshold. Widen the window.
Replay-linked share is near zero. Replay capture is sampled. If you want slow sessions watchable, raise the sample rate for the slow path specifically rather than globally — see the performance SDK guide.
Where the data comes from#
From the SDK
Served by
Analytics
App health