Page load
Page load in the Monitor area (Performance) — route /monitor/page-load.
Page load lives in the Monitor area of the dashboard, under Performance.
At a glance#
| Dashboard route | /monitor/page-load |
| Area | Monitor (monitor) |
| Group | Performance |
| Platforms | Web apps only. Hidden for mobile apps. |
What it does#
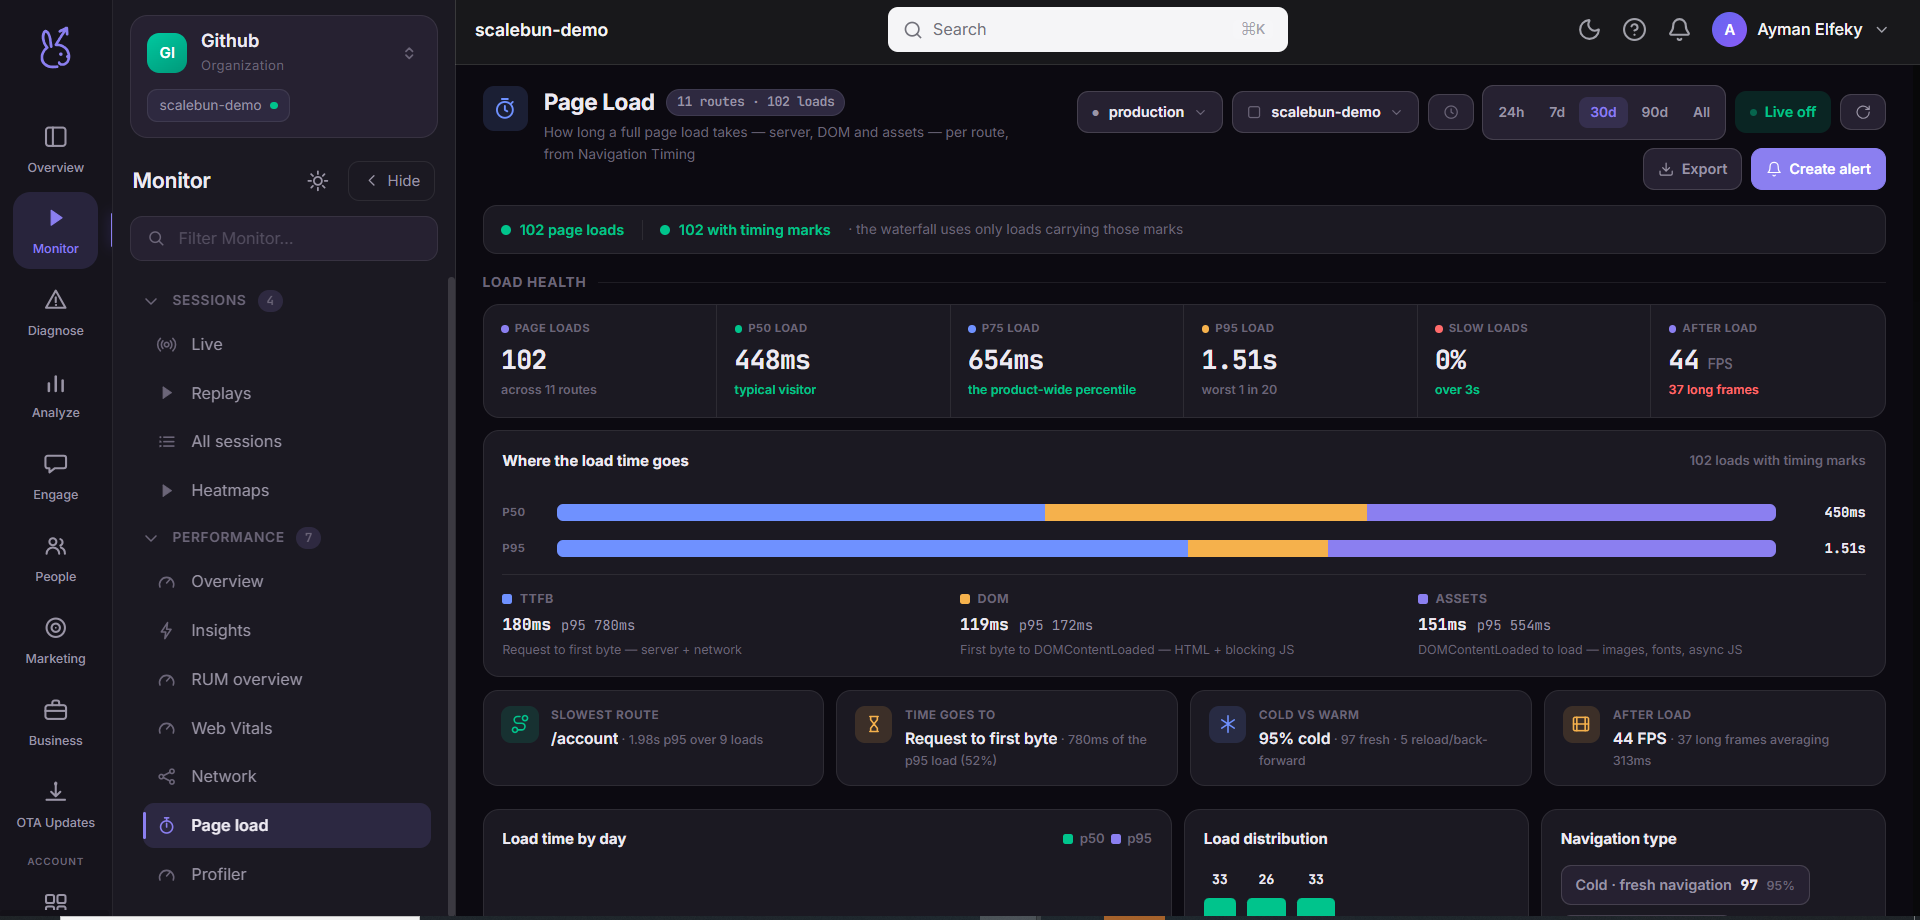
Page load is the web counterpart to Screen load: a KPI strip, a TTFB → DOMContentLoaded → Load waterfall, a per-route percentile table with a drawer, a load-time distribution and trend, and a folded-in rendering panel covering frame rate and long animation frames.
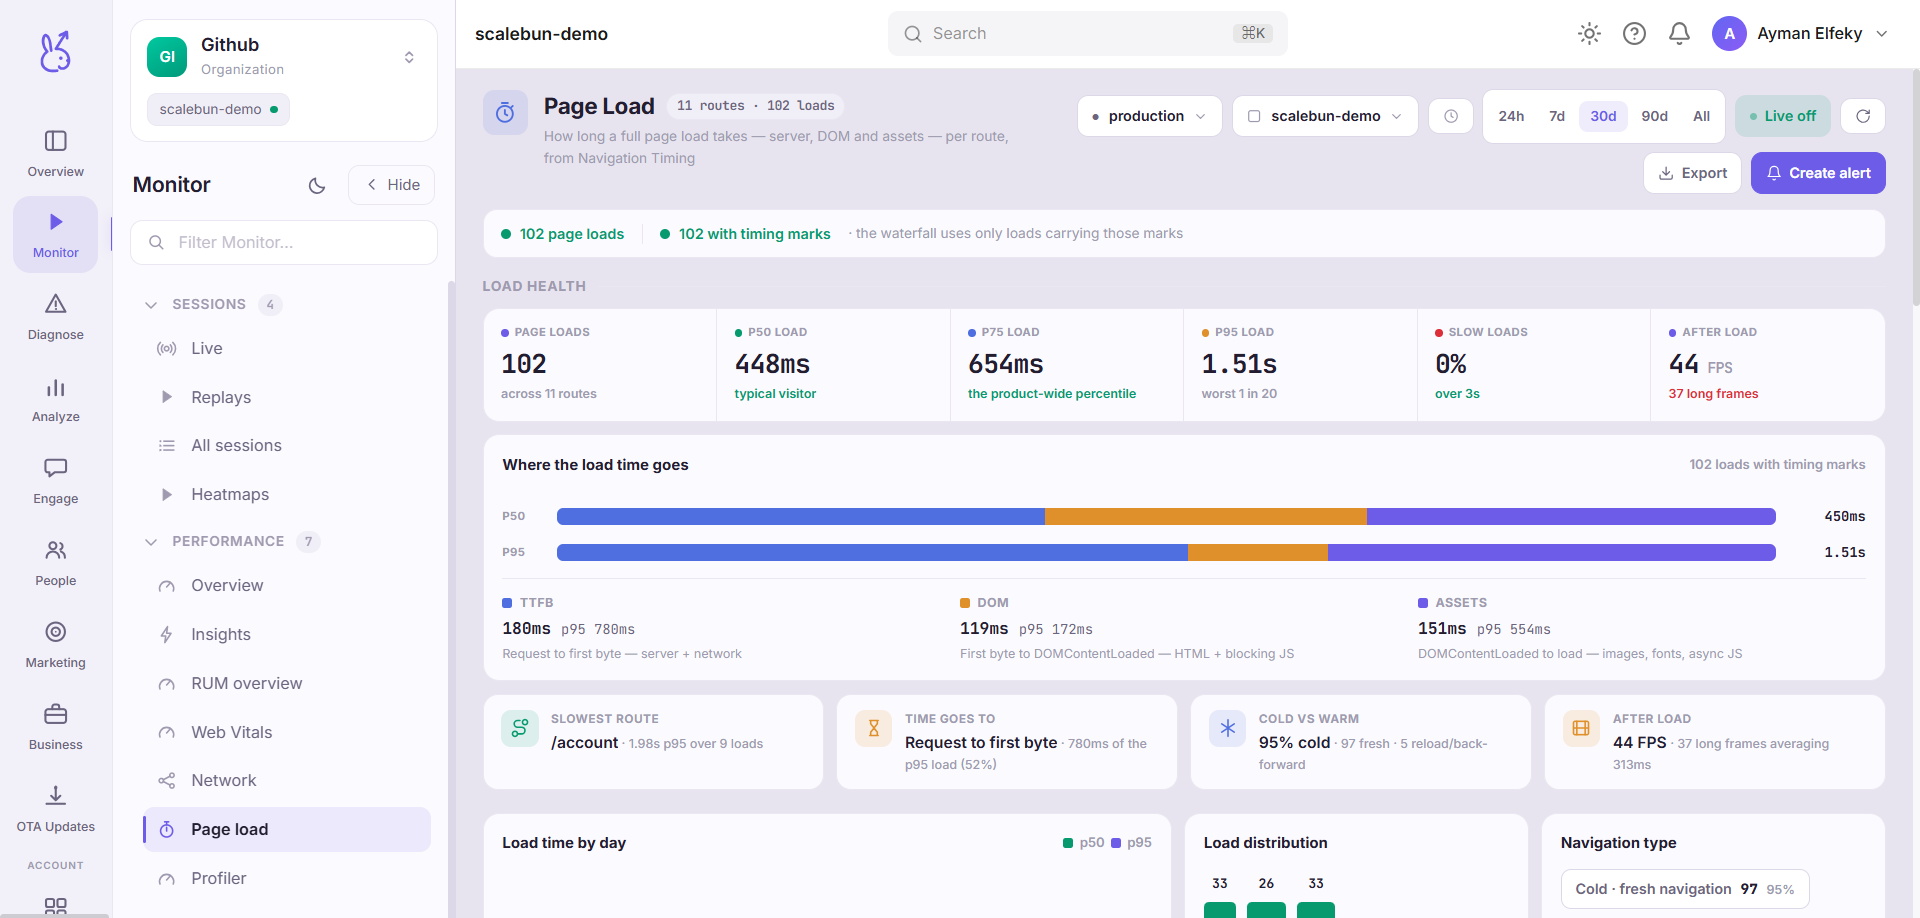
Routes are reported by template, and navigation type is recorded — a hard navigation and a client-side route change in a single-page app are different populations, and mixing them makes both meaningless.
When to use it#
When a route feels slow to arrive, and after any change to routing, bundling, or server rendering. Page load answers "how long until something is there"; Web Vitals answers "was the experience good". You want both, but this page is the one with per-route detail.
Workflow#
Split hard navigations from SPA transitions
A slow first load is a delivery problem — bundle size, TTFB, render blocking. A slow in-app transition is a code problem in your route handler. Fixing one does nothing for the other.
Read the waterfall
TTFB dominant means the server or the network. The gap from TTFB to DCL means parse and execute. The gap from DCL to Load means late resources.
Sort routes by p95 and check volume
Your slowest route may be an admin page three people visit.
Check the rendering panel
Fast arrival followed by a janky, unresponsive page is a worse experience than a slightly slower load. Long animation frames here connect to Jank for script-level attribution.
Permissions and prerequisites#
Web apps only. Requires web performance reporting in the SDK.
Limits and edge cases#
Route templates, not URLs. A route containing a resolved id would create one row per entity. If your rows look unbounded, the template is wrong.
Load timing is not available on every navigation. Prerendered and restored-from-cache navigations report a subset, so some rows will have fewer phases than others.
This shares its core data path with screen load. Web sends the same load measurement with a page-load kind, which is why the two pages feel identical by design.
Troubleshooting#
One route has an absurd p95. Look for a redirect chain or an authentication bounce inside that route — both are measured as part of the load the user waited through.
The waterfall phases do not add up to the total. They are not intended to: phases overlap, and the total is wall-clock. Use the phases for proportion, not arithmetic.
Where the data comes from#
Core percentiles share the screen-load path (web sends the same load measurement with a page-load kind); the waterfall and rendering panel come from web-specific reads.
From the SDK
Served by
Analytics
Dashboard