RUM overview
RUM overview in the Monitor area (Performance) — route /monitor/rum.
RUM overview lives in the Monitor area of the dashboard, under Performance.
At a glance#
| Dashboard route | /monitor/rum |
| Area | Monitor (monitor) |
| Group | Performance |
| Platforms | Web apps only. Hidden for mobile apps. |
What it does#
RUM overview is the front door for the web-only real-user-monitoring signals. It shows a KPI card per signal — each with a value, a trend trace and its current worst offender — over three ranked panels listing the specific transactions, resources and jank events dragging each signal down, with a severity badge and a magnitude bar per row.
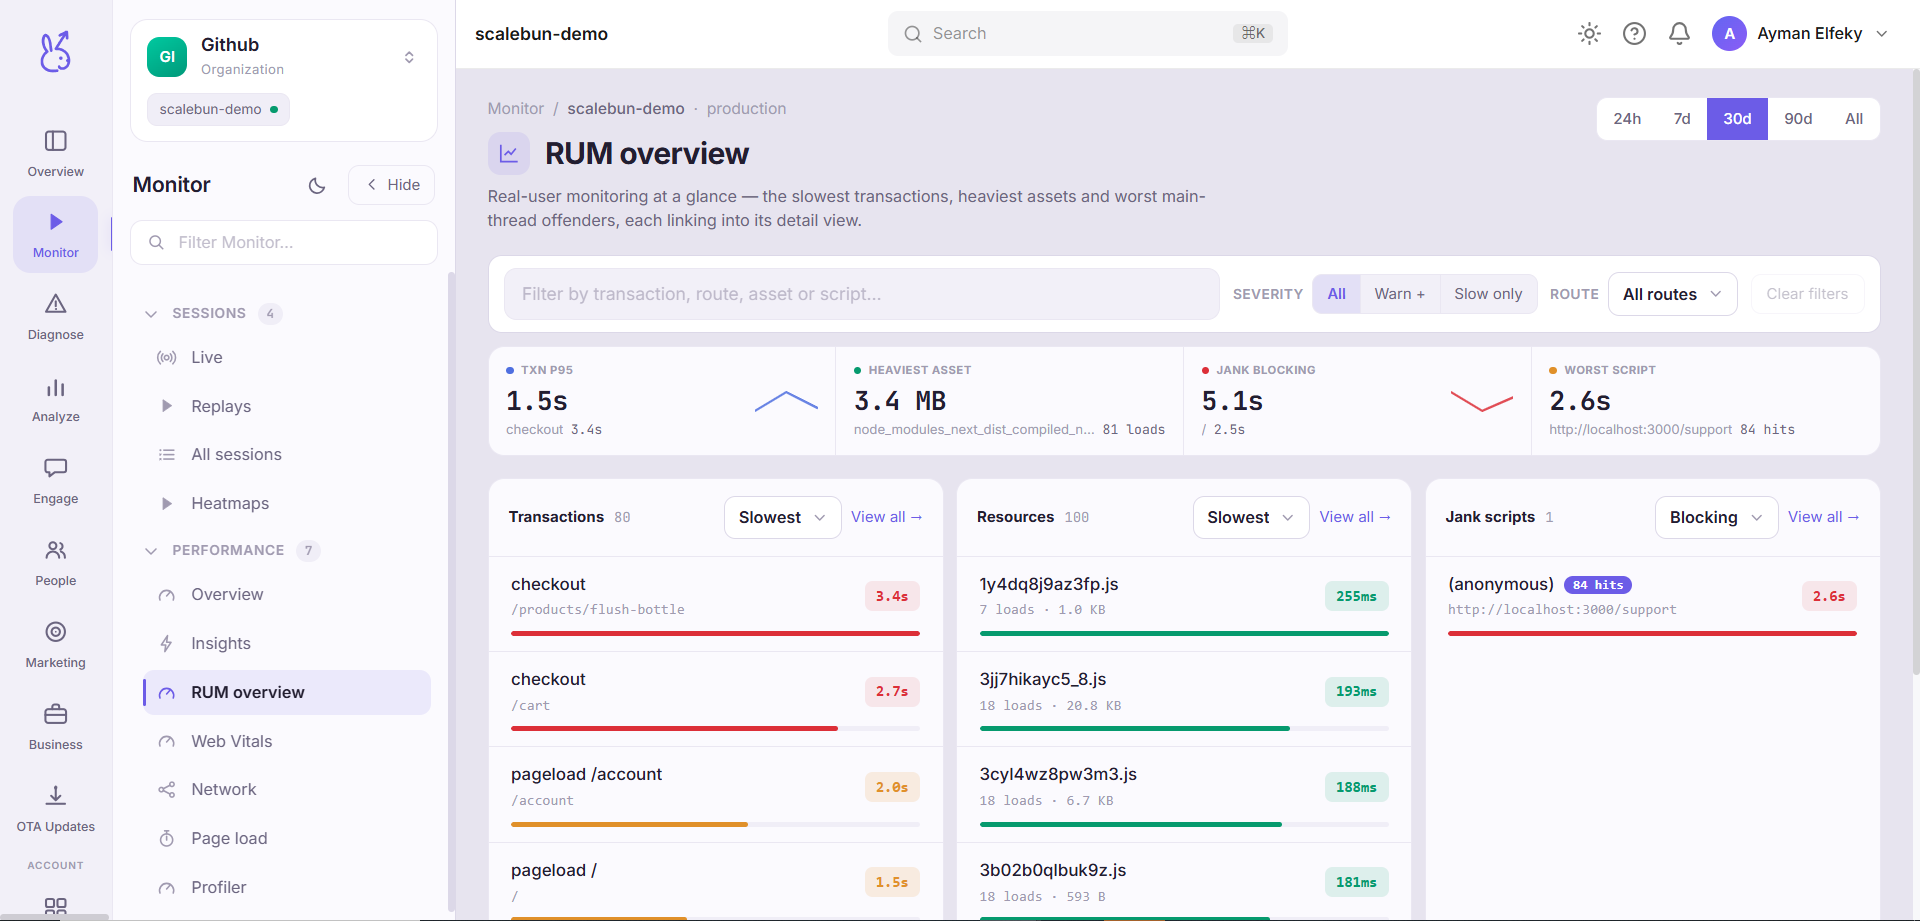
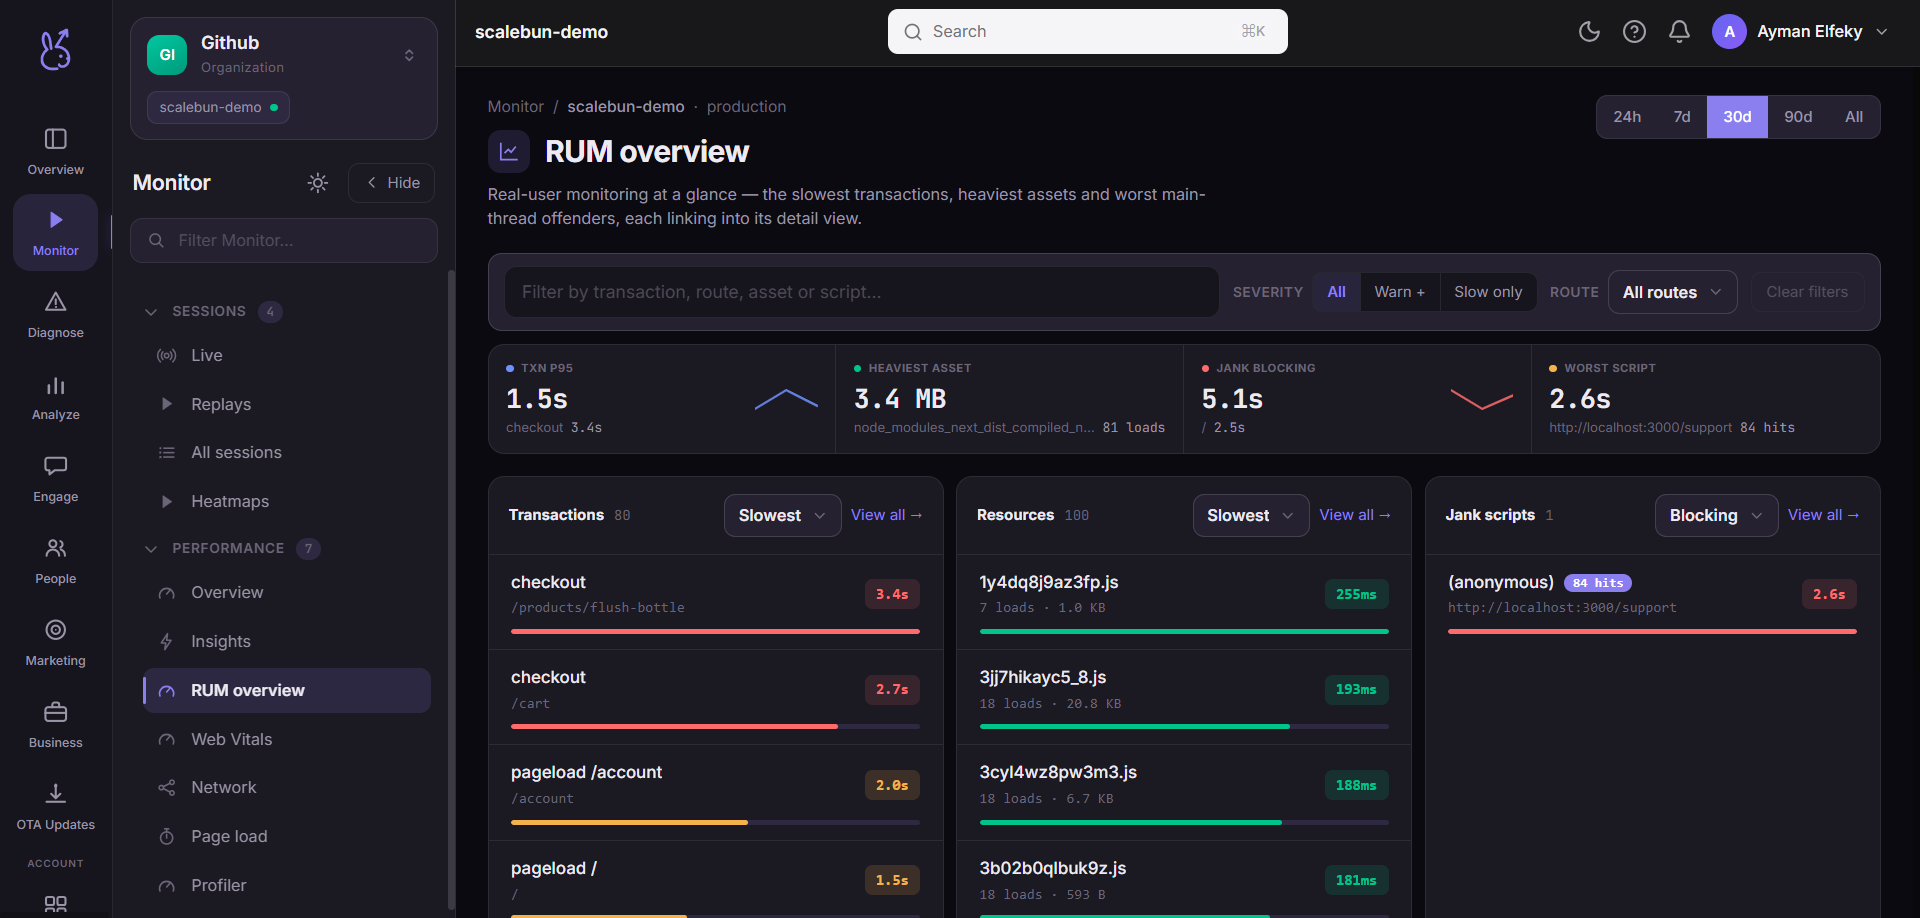
It reads from the same data as Traces, Resources and Jank — this page is a composed view of those three, not a fourth measurement.
When to use it#
As the first web performance page you open. The named worst offender on each card usually identifies the problem before you have clicked anything, which is the whole design intent: get to a specific slow thing in one screen rather than three.
Workflow#
Read the three card footers
Each names its current top offender. If the same route or asset appears under two cards, start there — it is causing more than one symptom.
Use the severity badges to triage
Duration-based signals are graded against the slow budget. Jank has no good zone, because blocking the main thread is never neutral.
Click through to the signal page
This page is deliberately shallow. Attribution, waterfalls and phase breakdowns live on the three pages it summarises.
Permissions and prerequisites#
Web apps only — mobile apps see Performance overview as their equivalent front door. No separate configuration; if the three underlying signals report, this page populates.
Limits and edge cases#
Derived, not measured. Every number here comes from the three underlying reads, so a discrepancy with one of those pages means a different time window, not a different truth.
Percentiles over a sampled set. Traces and jank are sampled, which is fine for ranking and poor for counting.
An empty panel means that signal has no data, which on a new integration is expected and is shown as empty rather than as zero.
Troubleshooting#
One card is blank. That signal is not reporting. Open its own page — the specific empty state there explains why, which for the Profiler and Jank is usually a browser or header requirement.
Numbers differ from the signal page. Match the time window. This page and each signal page each carry their own selector.
Where the data comes from#
A composed view over the traces, resources and jank reads — it adds no measurement of its own.
From the SDK
Served by
Analytics