Event Debugger
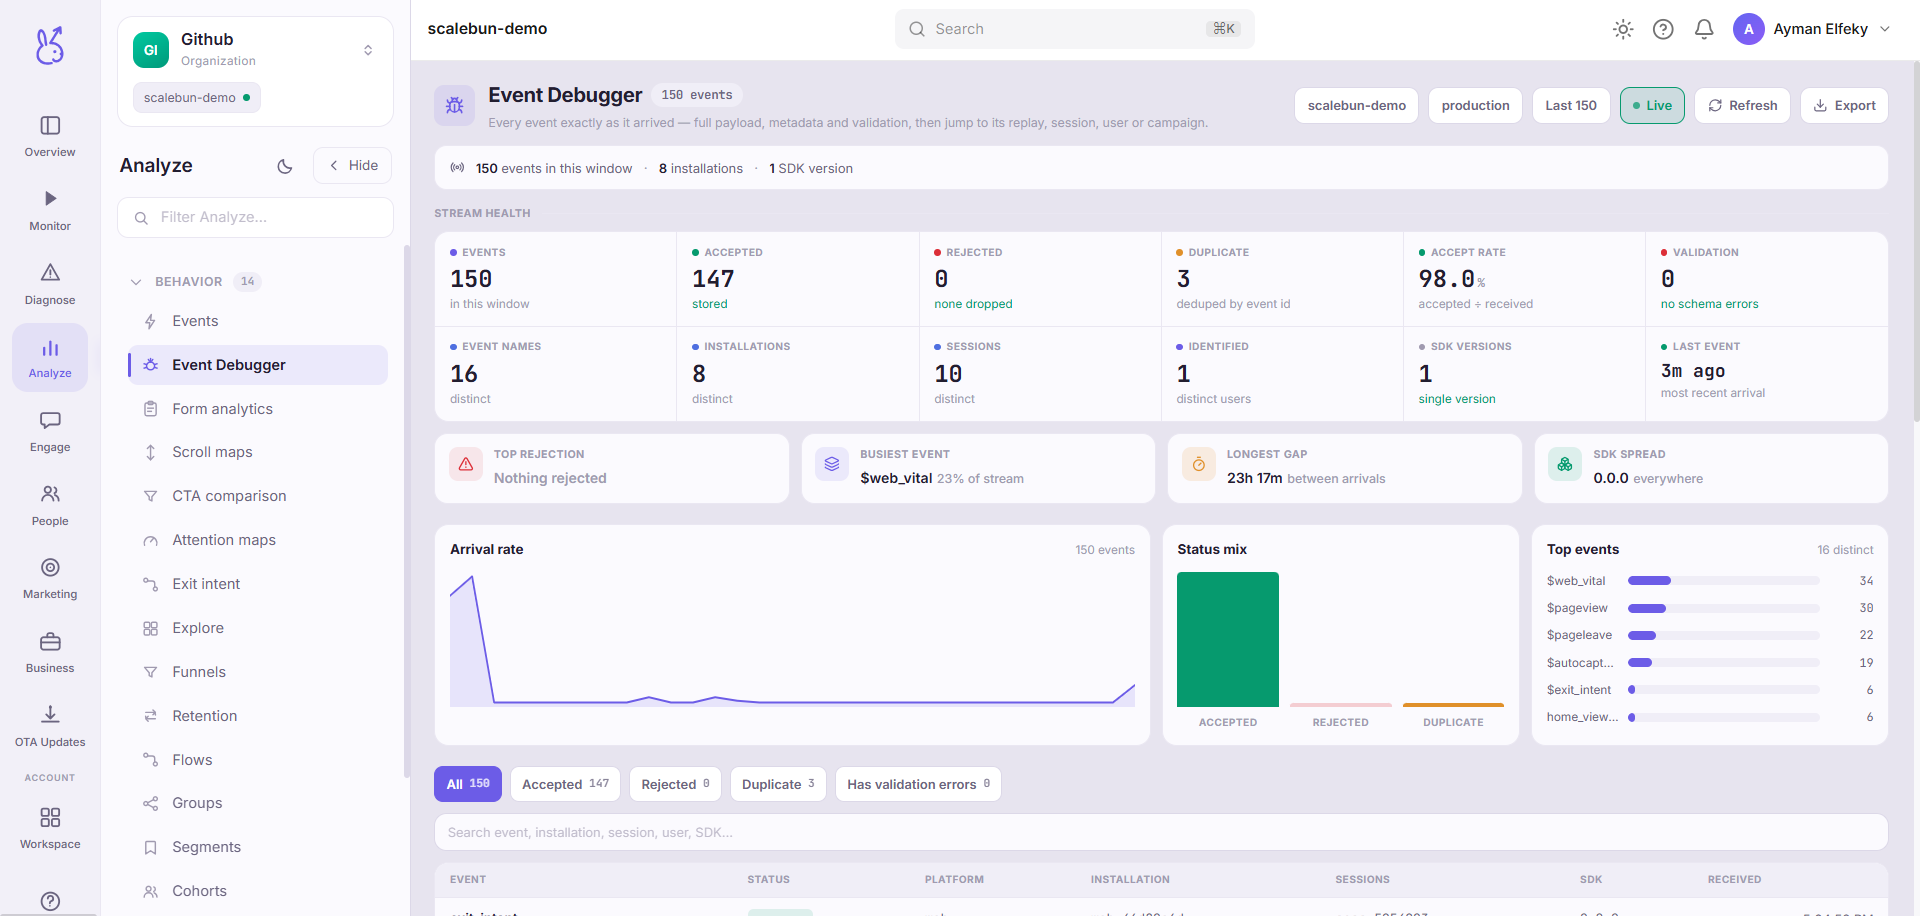
Event Debugger in the Analyze area (Behavior) — route /analyze/event-debugger.
Event Debugger lives in the Analyze area of the dashboard, under Behavior.
At a glance#
| Dashboard route | /analyze/event-debugger |
| Area | Analyze (analyze) |
| Group | Behavior |
| Platforms | Available for every app platform. |
What it does#
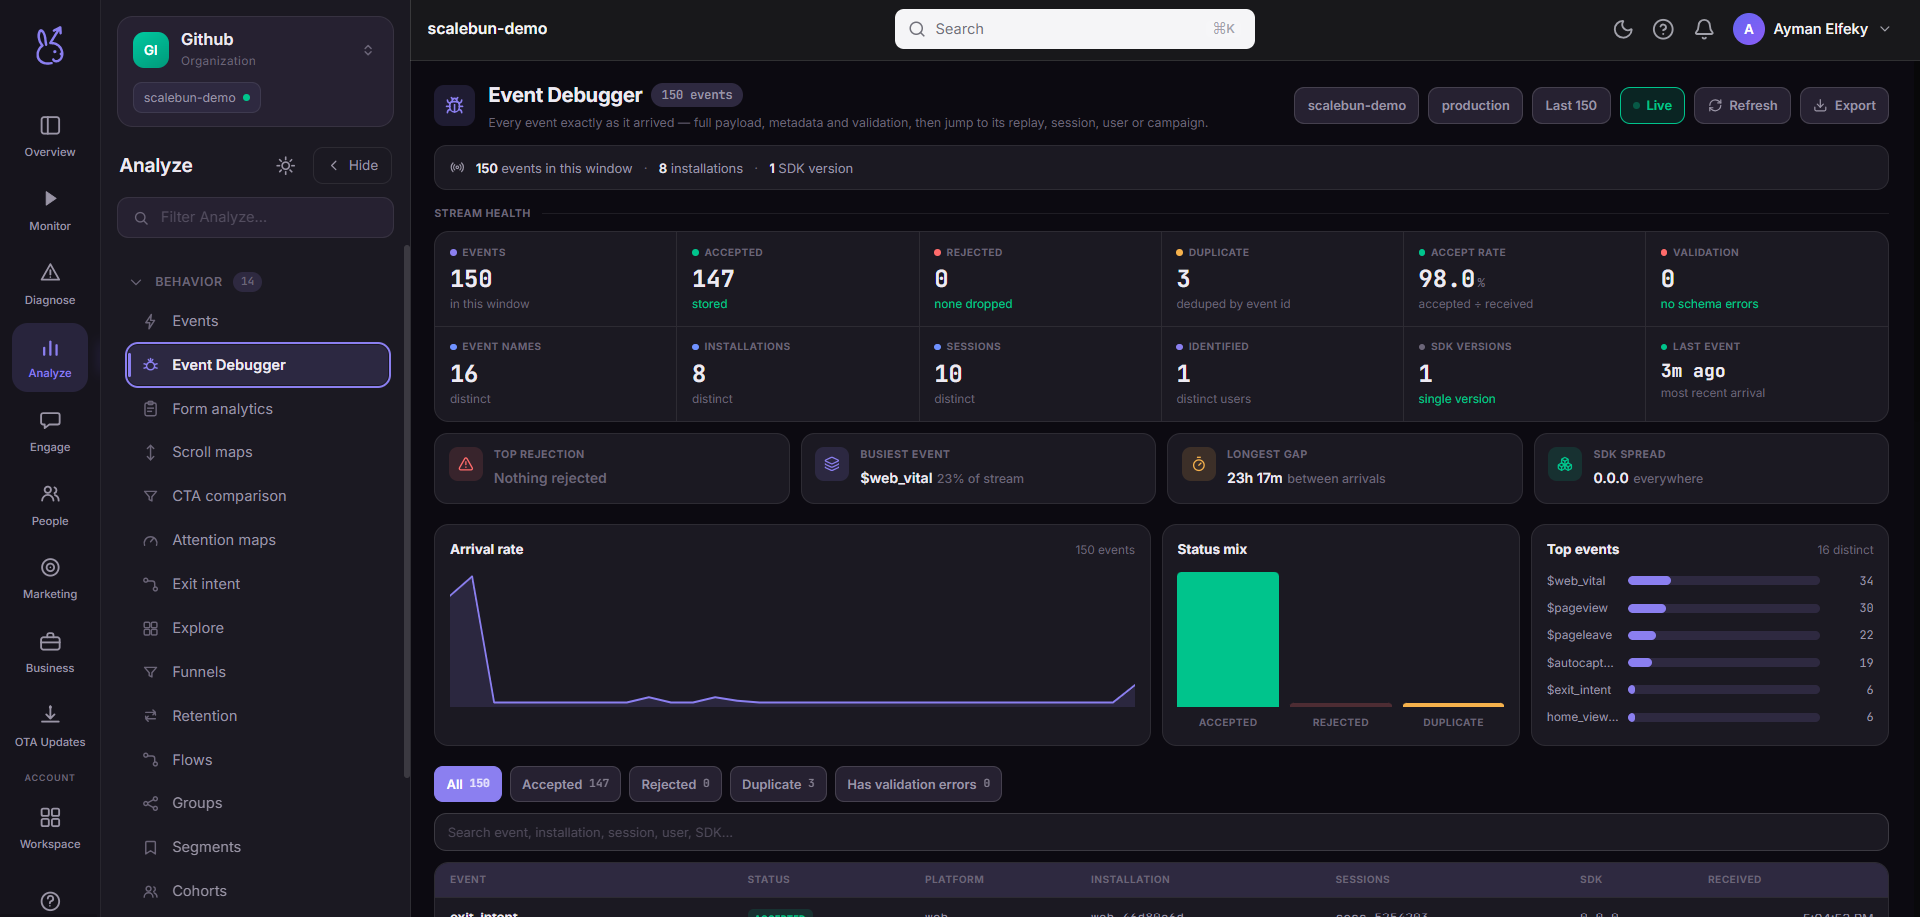
The Event Debugger shows the raw event stream for a single device in near real time — event names, properties and arrival order, exactly as the SDK sent them.
When to use it#
Before trusting any funnel, retention curve or conversion number built on an event you have not verified. And first, whenever an analytics result is surprising.
Workflow#
Identify your test device
Call
ScaleBun.identify()with a known id, or find the device by its recent activity.Perform the action
Trigger the flow in the app while watching the stream.
Check three things, in order
Did the event arrive at all? Is the name exactly what your funnel expects? Do the properties carry the values you will group by?
Common findings#
| Symptom | Usual cause |
|---|---|
| Event missing entirely | Never instrumented, or the code path did not run |
| Event arrives, funnel empty | Name mismatch — a typo, or casing differs from the funnel |
| Property missing | Passed undefined; the SDK omits it rather than sending null |
| Duplicate events | Called in a component that re-renders, rather than in an effect |
| Nothing at all from the device | Wrong environment key — check the key prefix |
Where the data comes from#
Shows the raw event stream for a device — the fastest way to tell an instrumentation problem from a product problem.
From the SDK
Served by
Tracking
SDK ingestion
Related#
Events SDK guide — designing names that survive contact with a funnel.