Cohorts
Cohorts in the People area (Audiences) — route /people/cohorts.
Cohorts lives in the People area of the dashboard, under Audiences.
At a glance#
| Dashboard route | /people/cohorts |
| Area | People (people) |
| Group | Audiences |
| Platforms | Available for every app platform. |
What it does#
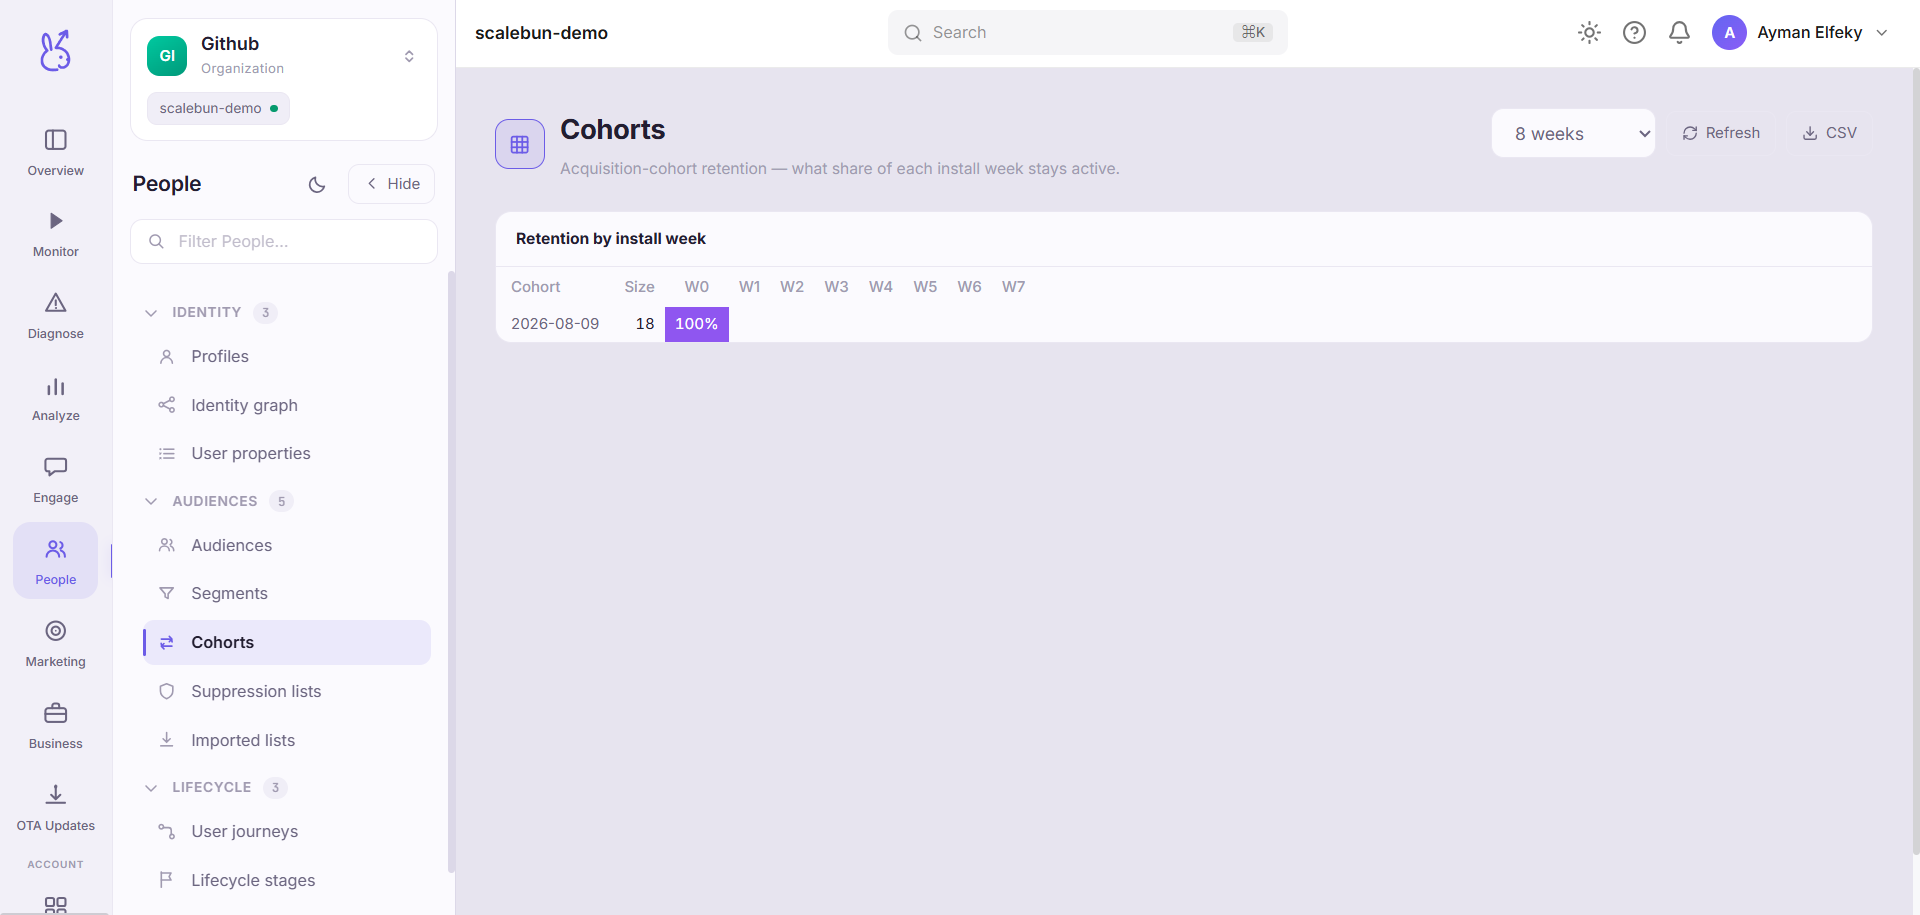
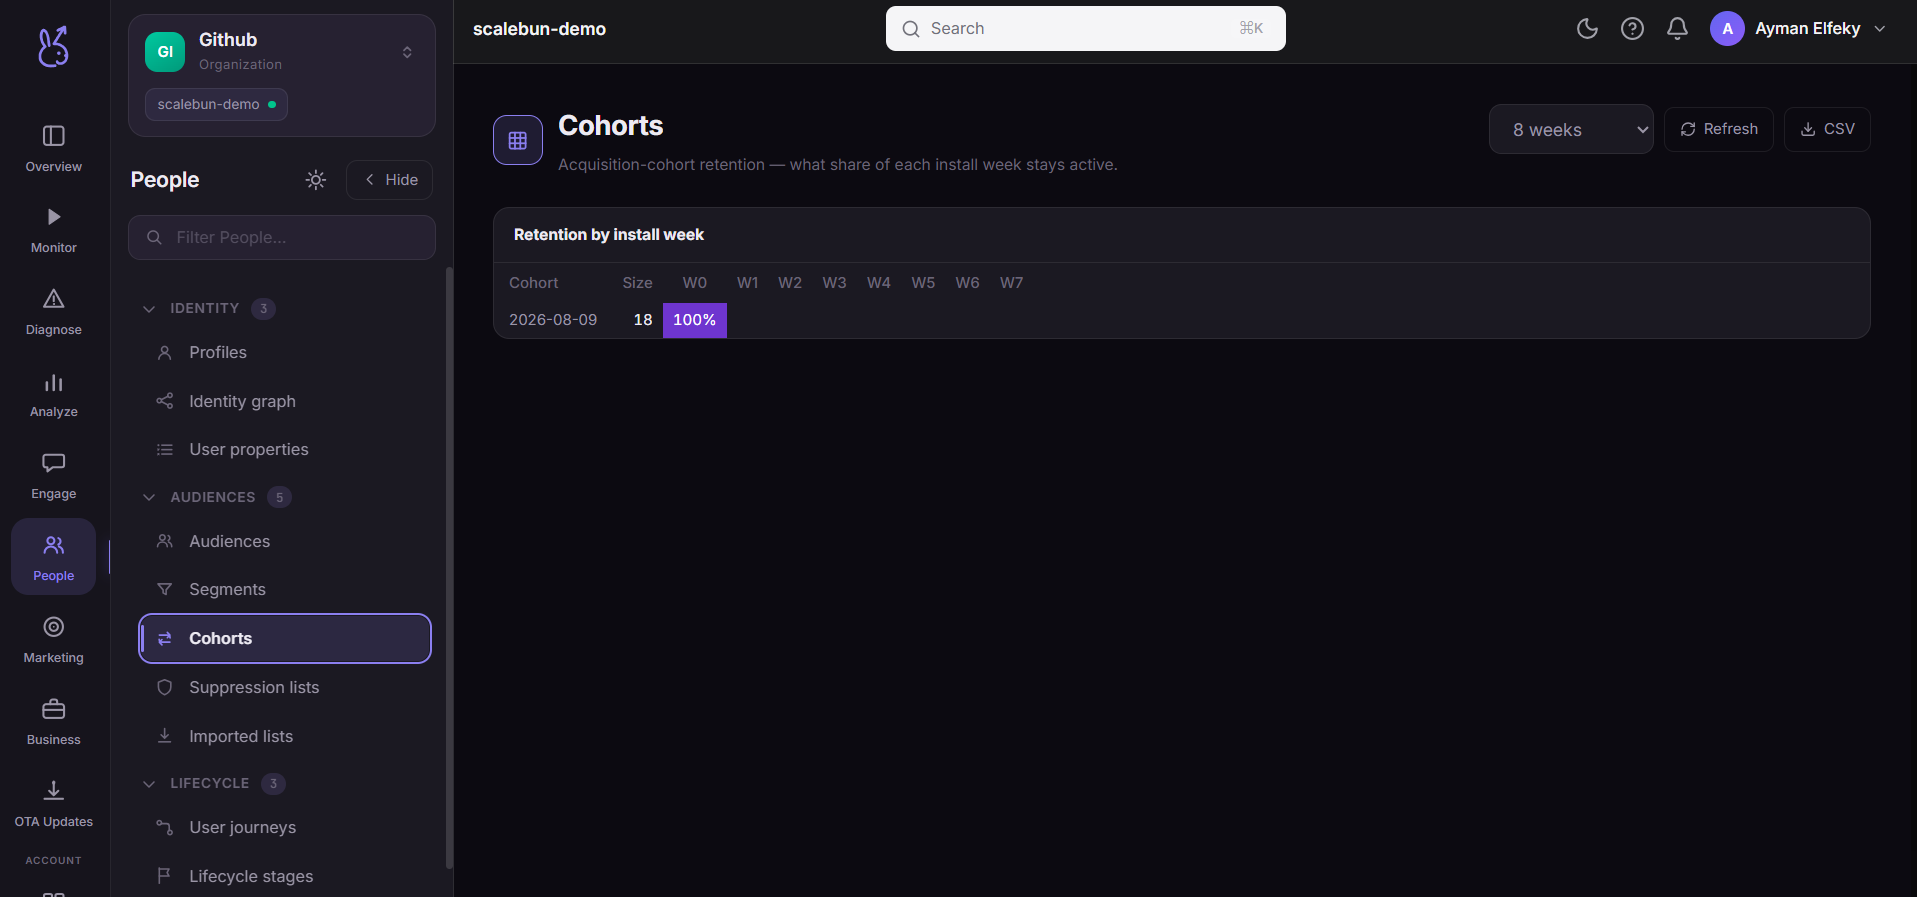
Cohorts is a retention grid: users grouped by when they first arrived, with each row showing what proportion of that group came back in each subsequent period. Cell intensity encodes the percentage, so the shape is readable before you read any number.
A segment is defined by what a user is. A cohort is defined by when they started, and it never changes membership — which is exactly what makes it comparable across time.
When to use it#
To answer "is the product getting better?" — the one question no single-period metric can address. Weekly active users can rise while every individual cohort retains worse than the one before it, and that is a business that is buying growth rather than earning it. Only this grid shows the difference.
Workflow#
Read down the first column, not across a row
Column one is early retention by cohort. If it is falling as you go down, your recent cohorts are worse — that is the signal, and it is about acquisition or onboarding.
Read across a row for the shape of the decay
A curve that flattens has found its committed users. One that keeps declining has no floor yet, which is the harder problem.
Compare like periods only
Cohort three weeks in cannot be compared to cohort three days in. Only the same column is comparable.
Ignore the newest cohorts
The bottom rows are incomplete by construction. They will fill in, and reading them early is the most common mistake with this chart.
Permissions and prerequisites#
Requires event ingestion with a reliable notion of a returning user, which in practice means identified users — otherwise a returning person on a new device looks like a new one.
Limits and edge cases#
The lower-right of the grid is empty because time has not passed, not because retention is zero.
Cohort sizes vary. A row built from 40 users will look volatile next to one built from 4,000. Check the size before believing a jump.
Retention is defined by return, and "return" depends on your instrumentation. If your app can be used without generating an event, this understates retention.
Anonymous users inflate new cohorts and deflate retention. Identity quality bounds the accuracy of everything on this page.
Troubleshooting#
Retention looks impossibly bad. Check identity first. Unlinked devices are counted as new users each time, which is the classic cause.
One cohort is an outlier. Look for a campaign, a launch, or a bot. Outlier cohorts almost always have an acquisition explanation.
Where the data comes from#
Served by
Cohorts