Logs
Logs in the Diagnose area (Issues) — route /diagnose/logs.
Logs lives in the Diagnose area of the dashboard, under Issues.
At a glance#
| Dashboard route | /diagnose/logs |
| Area | Diagnose (diagnose) |
| Group | Issues |
| Platforms | Available for every app platform. |
What it does#
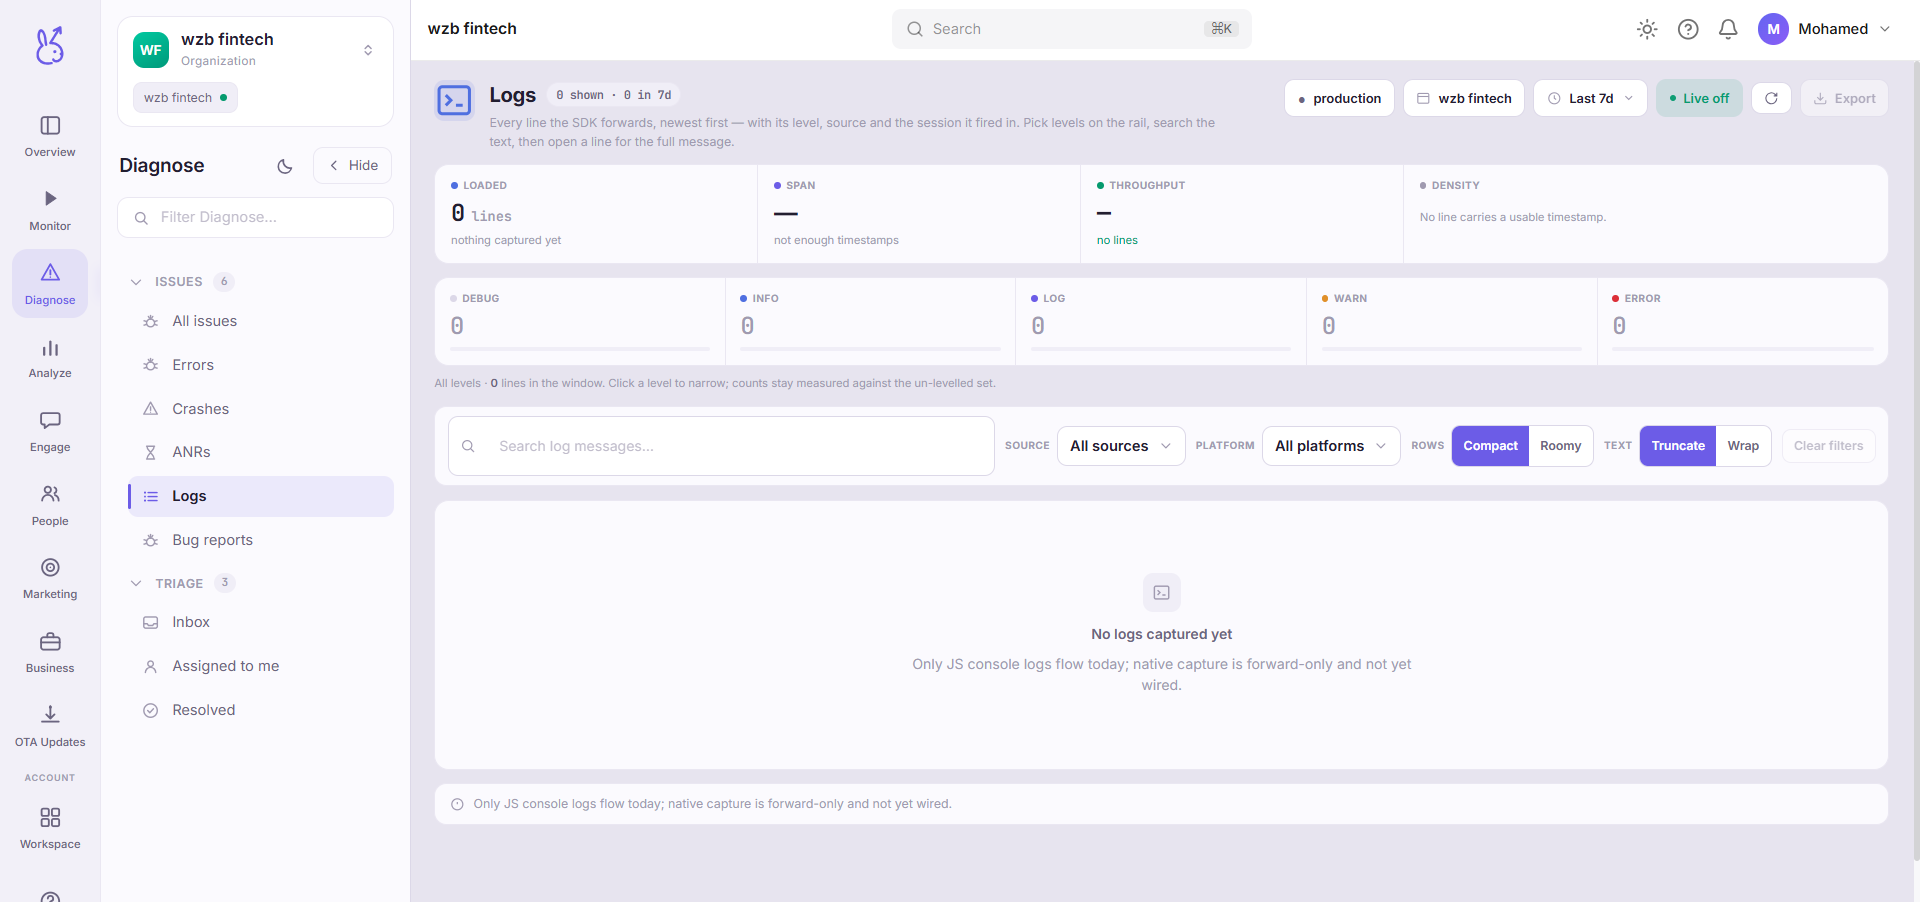
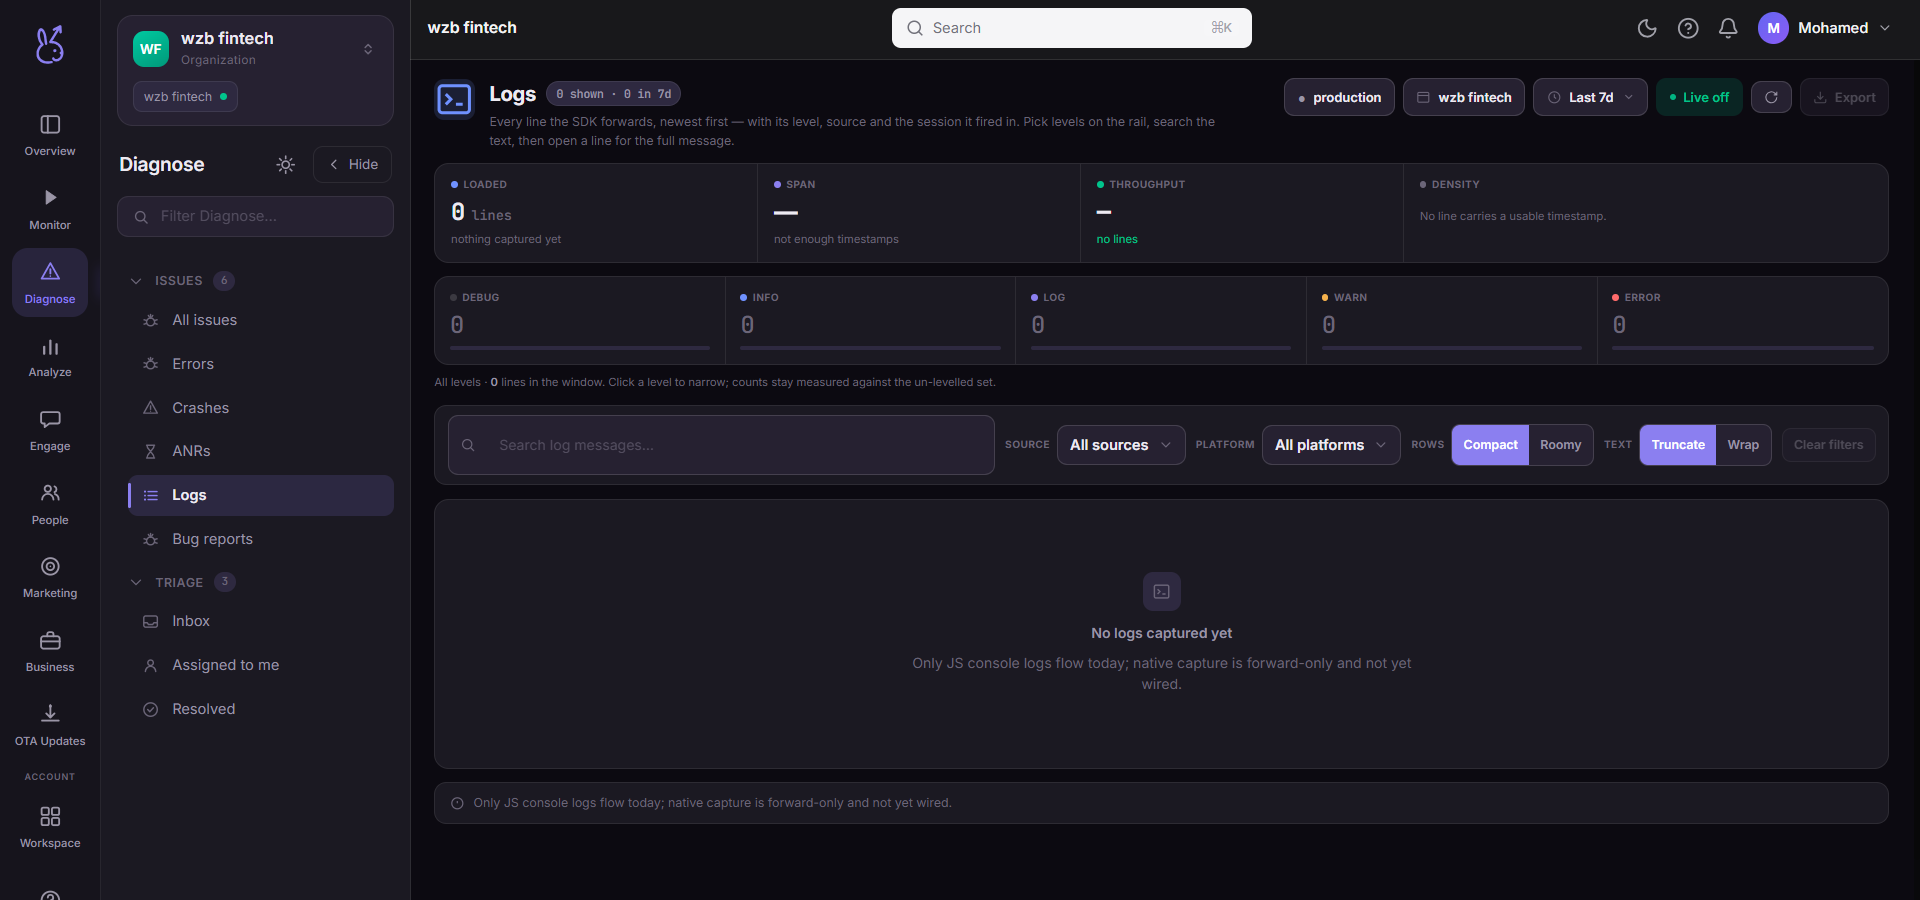
Logs is a searchable stream of log lines captured from your app, with filters for level, free-text search, source, platform and time window. Every filter drives a server-side refetch rather than narrowing what is already on screen, so the window you pick is the window that is queried. Expanding a row shows the full entry, and a line carrying a session id links straight to that session.
When to use it#
After you know where the problem is and need to know why. An issue tells you a function threw; the log lines around it tell you what the state was. Reach for this page third — after the issue and after the replay — because it is the least structured view in Diagnose and therefore the slowest to read.
Workflow#
Narrow the window first
Log volume is the enemy of log search. Set the window to the minutes around the failure before you type anything into the search box.
Filter by level, then search
The level facets show how much of the window is at each level. Errors and warnings first; drop to info only when they do not explain it.
Jump to the session
A line with a session id is the bridge from a log to a person. Following it gives you the whole visit around that line, which is usually the answer.
Permissions and prerequisites#
Nothing to configure in the dashboard. What appears here depends entirely on what the SDK is able to capture — see the limit below.
Limits and edge cases#
Forward-only. The pipeline is new; there is no history before your integration.
Not a substitute for server logs. These are client-side lines. A failure that happened entirely in your backend leaves nothing here beyond the failed request.
Search is over the captured text. It cannot find a line that was never captured, which includes anything logged before SDK initialisation.
Troubleshooting#
Nothing in the stream. Confirm the window covers real traffic and clear the filters. If it is still empty, the app may be logging exclusively from native code — see the limit above.
A log I can see in my terminal is not here. Development-mode output does not necessarily route through the captured console. Check against a build with the SDK actually reporting.
Where the data comes from#
From the SDK
Served by
Logs