User health
User health in the People area (Lifecycle) — route /people/user-health.
User health lives in the People area of the dashboard, under Lifecycle.
At a glance#
| Dashboard route | /people/user-health |
| Area | People (people) |
| Group | Lifecycle |
| Platforms | Available for every app platform. |
What it does#
User health scores individual customers on churn risk and predicted lifetime value, with a health grade per person and reason codes explaining each score — the factors that contributed and how much each weighed.
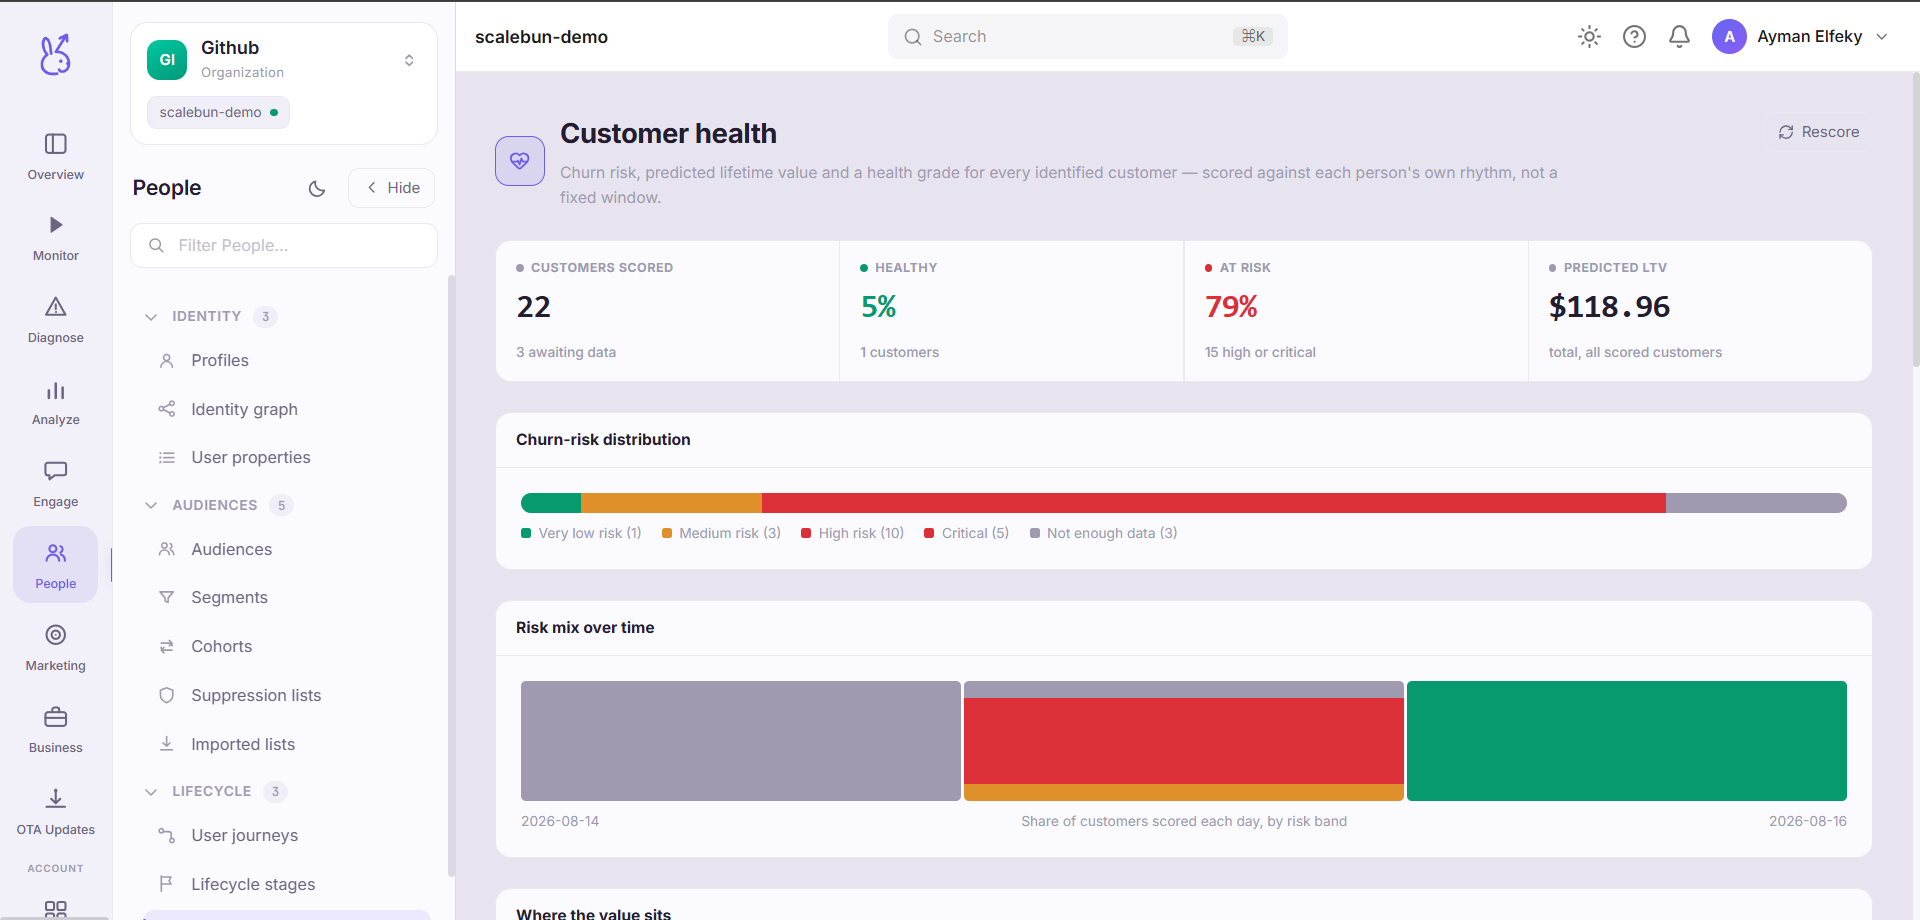
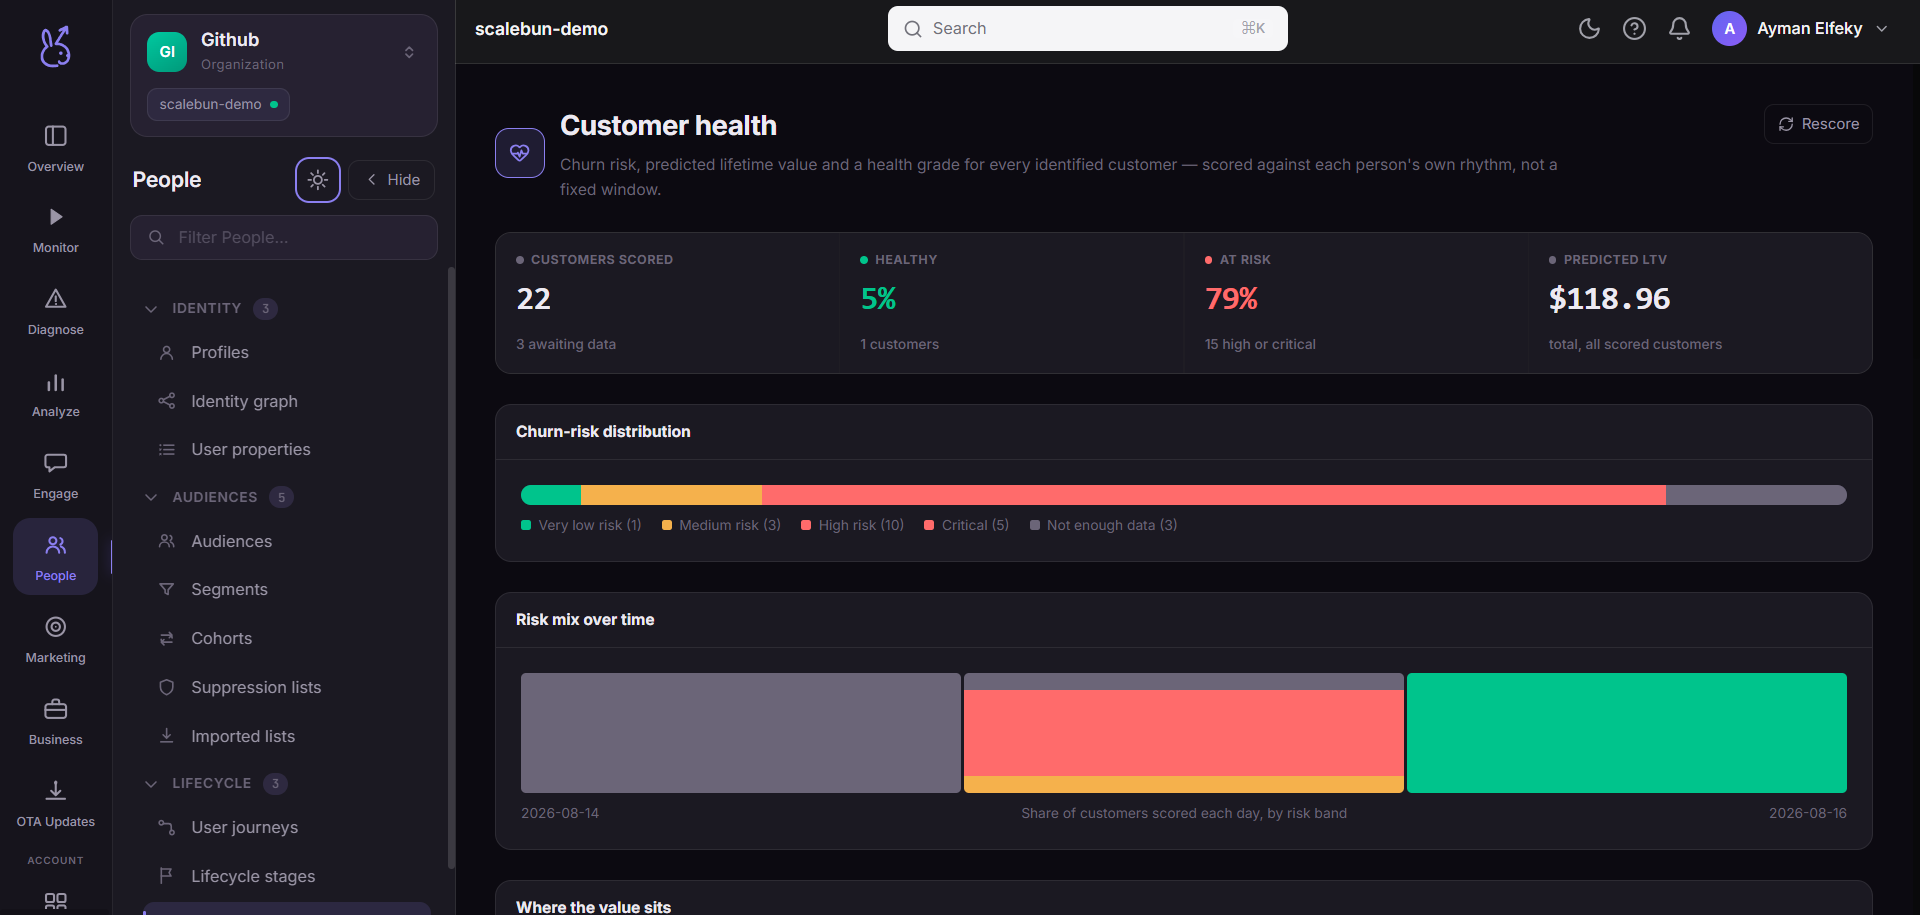
The layout is a KPI row, then a distribution bar across health bands, then the table of people.
The important property is how idleness is judged: against each user's own rhythm, not a fixed threshold. A customer who has always used the product monthly is not flagged for behaving monthly. A daily user silent for four days is.
When to use it#
For retention work where you need to know who, not how many. Lifecycle stages tells you the distribution; this page hands you a named list ranked by risk, which is what an intervention needs.
Also for prioritising support and success effort: predicted LTV alongside churn risk is the pair that identifies who is both valuable and leaving.
Workflow#
Sort by churn risk, then filter by value
High risk and low value is a population, not a task. High risk and high value is a list of calls to make.
Read the reason codes
The score says leaving; the codes say why. Without them you cannot design an intervention, only a generic one.
Act on the at-risk band, not the churned one
A churned user has already gone. The band before it is the whole point of scoring.
Check back for movement, not for absolute scores
A score falling week over week is more actionable than its level.
Permissions and prerequisites#
Requires enough history for a per-user rhythm to be established, and identified users — a score attached to a device tells you nothing about a person.
Limits and edge cases#
New users cannot be scored well. Rhythm needs history; expect low confidence for recent signups.
A behaviour change looks like risk. A user who switched from daily to weekly deliberately scores as declining, because from the data those are identical.
Reason-code weights are relative, not percentages of a total.
Troubleshooting#
Everyone scores as at-risk. Usually insufficient history, or an app where the natural usage interval is long. Check that the population has enough events for a rhythm to exist.
A score contradicts what I know about a customer. The reason codes will show which factor drove it. Model output losing to direct knowledge is the correct outcome.
Where the data comes from#
Served by
Growth scoring