SDK Health
SDK Health in the Overview area — route /overview/sdk-health.
SDK Health lives in the Overview area of the dashboard.
At a glance#
| Dashboard route | /overview/sdk-health |
| Area | Overview (overview) |
| Group | Ungrouped |
| Platforms | Available for every app platform. |
What it does#
SDK Health scores your instrumentation, not your app. It runs 13 detectors across 7 weighted categories over your incoming data and reports what is wrong with the pipeline: no events arriving, view events missing from a share of sessions, rejected payloads, duplicate payloads, mixed-type payloads, replay disabled, a conversions-API mismatch, an SDK version that has gone stale, a funnel step nothing has hit in a long time, a missing consent signal.
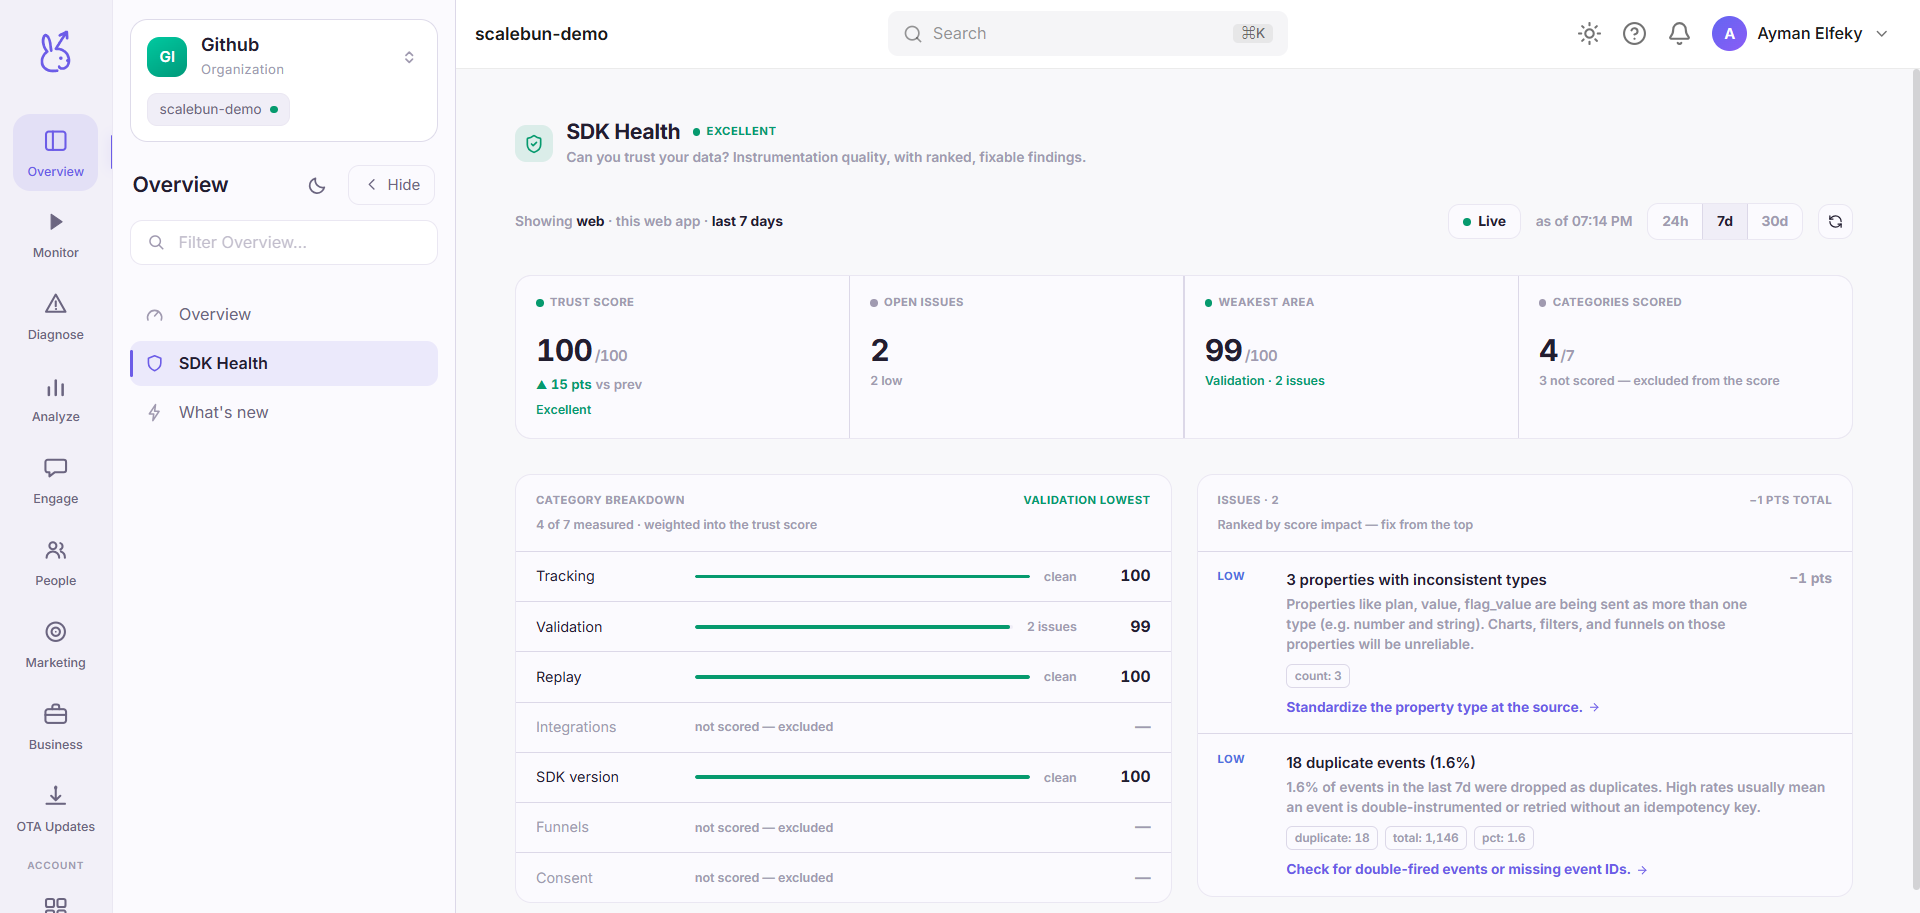
The distinction from the health summary is the entire point, so it is worth stating plainly:
| Page | Subject | Question it answers |
|---|---|---|
| Health summary | Your app | How are users experiencing it? |
| SDK Health | Your instrumentation | Can I trust that answer? |
A 99.9% crash-free score computed from a feed that silently dropped 40% of its sessions is a fact about the feed. This is the page that tells you so — which is why its score is framed as trustworthiness rather than as a second health figure.
When to use it#
Three times, reliably:
After integrating or upgrading the SDK. This is the acceptance test. Every other page will show something plausible whether or not your integration is correct; only this one will tell you it isn't.
Before quoting a number to anyone outside the team. Check the feed before you commit to the figure.
When a metric looks wrong in a way you cannot explain. Data problems and product problems look identical downstream. Start here and eliminate one.
Workflow#
Read the issue list, not the score
The score is a rollup for tracking over time. The listed issues are what you act on, and each one names a specific defect.
Fix ingestion failures before coverage gaps
Rejected, duplicated and mixed-type payloads mean data is being lost or corrupted now. A missing consent signal or a stale funnel step are real but not urgent.
Re-run after each fix
Detectors evaluate the recent feed, so a fix shows up as the issue disappearing rather than as a note that you fixed it.
Permissions and prerequisites#
Read access to the app. No configuration — the detectors run against whatever your app is already sending.
Limits and edge cases#
Detectors are heuristics over recent data. A very low-traffic app can trip "no events arriving" simply by being quiet, and a very new integration can trip several at once before any of them mean anything.
Categories are weighted, so the score is not a percentage of detectors passed. Two issues can move it by different amounts.
A clean score is not proof of correct instrumentation. It means nothing detectable is wrong. A correctly-delivered event with the wrong name is invisible here and visible in the event debugger.
Troubleshooting#
"No events arriving" on an app I know is live. Check the app and environment selector first — a staging environment with no traffic trips this legitimately.
"Stale SDK". A newer release exists and detectors are calibrated against current behaviour. Upgrade before investigating anything else, because some detections are only reliable on recent versions.
"View events missing on N% of sessions". Screen or route instrumentation is incomplete. This one is worth fixing early: nearly every screen-level metric in the product depends on it.
Where the data comes from#
Reports what the SDK is actually sending, which is why it is the first place to look when a metric drops unexpectedly.
From the SDK
Served by
SDK config
SDK ingestion