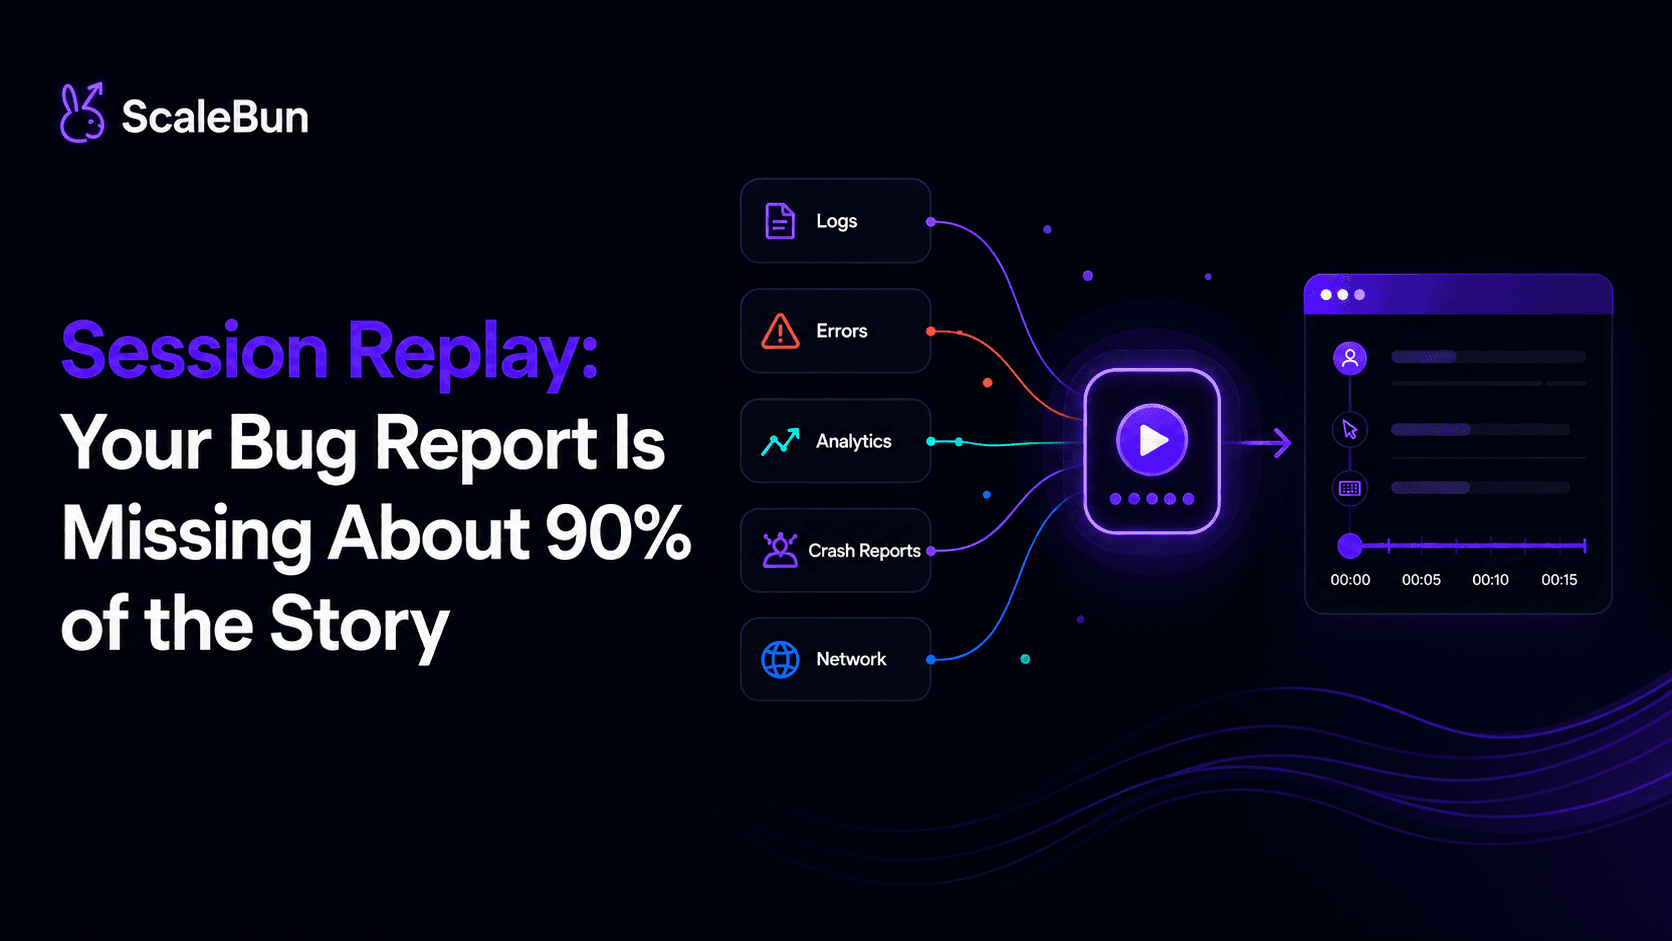
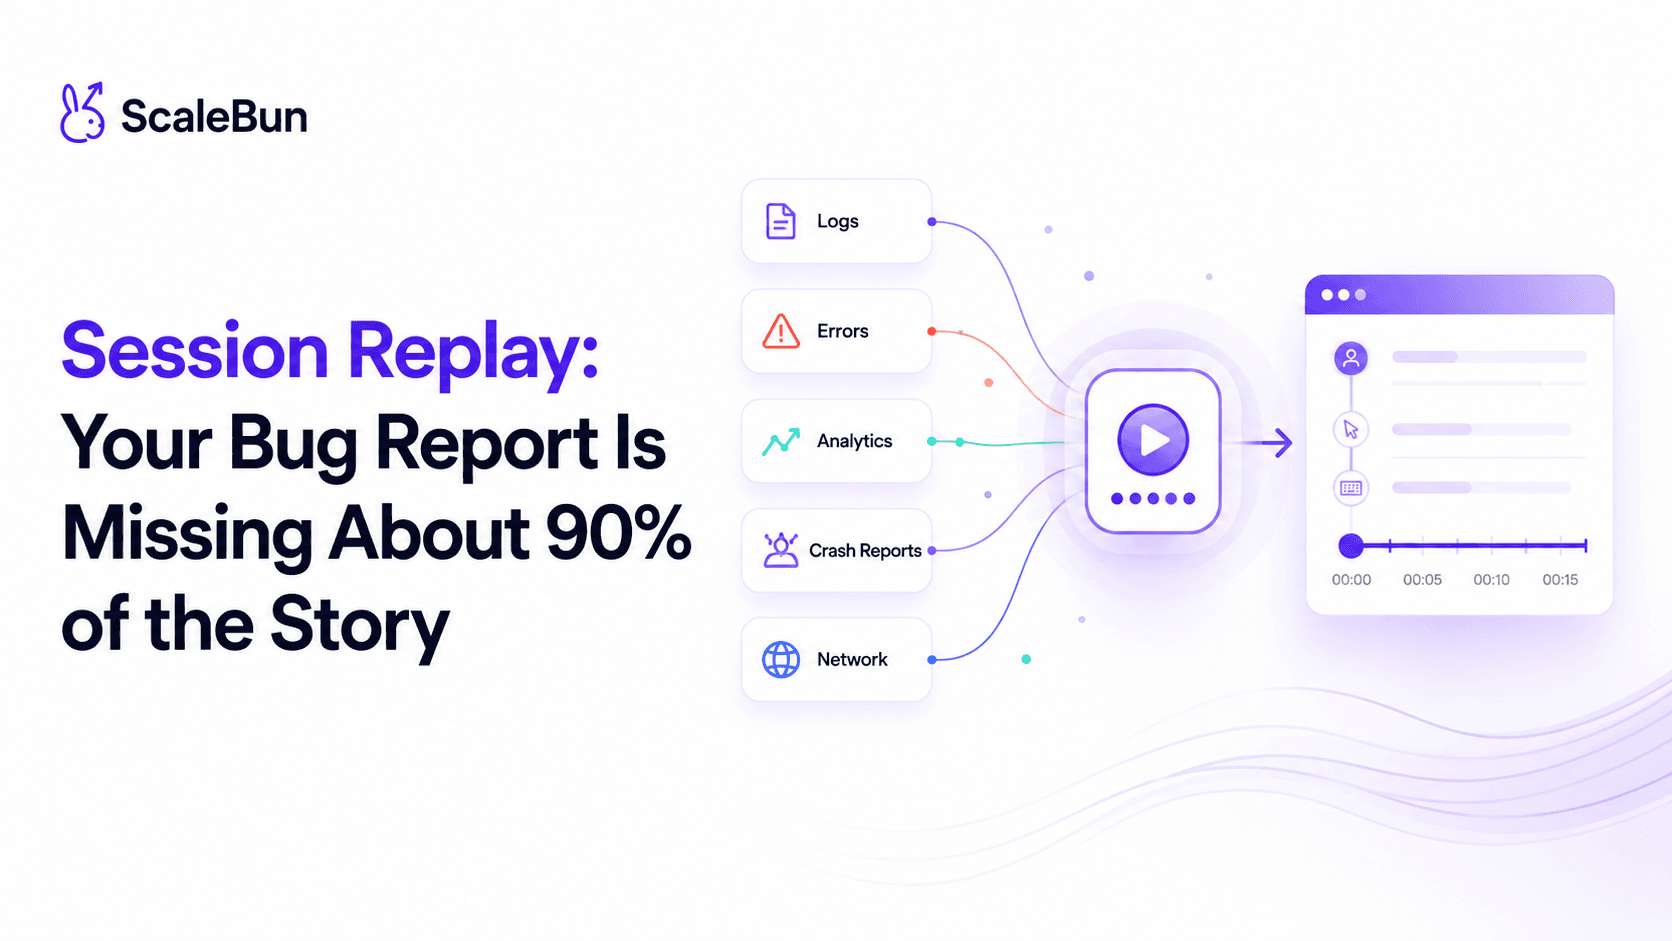
A bug report usually looks something like this:
“Checkout button didn’t work.”
Fantastic.
We now know the button existed.
The harder questions are still sitting there:
What did the user do before clicking it? What state was the application in? Did an API request fail? Did the interface freeze? Was the user clicking repeatedly because nothing happened? Did the problem affect one device or five thousand?
Traditional logging can answer pieces of that puzzle.
Session replay answers a different question:
What actually happened?
Replay is basically time travel for software#
A session replay system records enough information about an application's state and user interactions to reconstruct what the user experienced.
On the web, that can involve things like:
DOM state
mutations
clicks
navigation
scrolling
input interaction
application events
Mobile gets considerably more interesting because there isn't a browser DOM politely sitting there waiting to be observed.
You have native views, React Native components, gestures, navigation transitions, device-specific behavior, keyboard states, and a rendering system that doesn't particularly care about making your debugging life easier.
Which is why mobile replay is technically much harder than sticking a screen recorder inside an app.
And you generally don't want video recording anyway.
Video is expensive, difficult to query, terrible for privacy, and nearly useless as structured debugging data.
A proper replay system reconstructs behavior from events and application state.
That's the approach ScaleBun takes across web and React Native.
The interesting part isn't watching the video#
Watching somebody use your application is useful.
Connecting that replay to everything else is much more useful.
Imagine a customer complains that payment failed.
Instead of searching through six tools, an engineer opens the session and sees:
User opens checkout.
User selects Visa.
API request starts.
Request takes 4.8 seconds.
UI appears frozen.
User clicks Pay three more times.
Request fails.
JavaScript exception fires.
User leaves.
That's not merely session replay anymore.
That's a debugging timeline.
And the difference matters.
Because the goal isn't to create Netflix for watching your customers click buttons.
The goal is to reduce the distance between:
“Something went wrong.”
and
“Here is exactly why.”
Replay also changes product conversations#
Engineers aren't the only people who benefit.
Product teams often argue using analytics.
“Thirty-two percent of users abandon this screen.”
Useful.
But why?
Analytics tells you where people leave.
Replay can show you what happened immediately before they left.
Maybe the CTA looks disabled.
Maybe a modal covers it on smaller screens.
Maybe users repeatedly tap an element that isn't actually clickable.
Maybe a loading spinner lasts eight seconds.
Numbers tell you something is weird.
Behavior tells you what kind of weird.
The real feature is context#
Session replay is sometimes marketed as if replay itself is the product.
I think that's backwards.
Replay is a sensor.
The value comes from connecting it with:
errors
crashes
user identity
network behavior
device information
releases
performance
behavioral analytics
That's where ScaleBun becomes interesting.
Instead of treating a session as an isolated recording, it becomes the timeline around an engineering event.
And suddenly the world's worst bug report —
“Button doesn't work.”
— becomes considerably more useful.
JavaScript error trackers are extremely good at producing something like this:
TypeError: Cannot read properties of undefinedWonderful.
A computer has informed us that the computer is unhappy.
You get a stack trace.
A timestamp.
Maybe browser information.
Maybe the affected release.
All useful.
But there is still a giant hole in the story:
What was the user doing when it happened?
Errors don't exist in isolation#
Consider this error:
checkout.items.map(...)where items unexpectedly becomes undefined.
The stack trace tells you where the code exploded.
It doesn't necessarily tell you why items became undefined.
Maybe:
the API returned malformed data,
the user navigated backward during a request,
a stale cache entry was loaded,
a feature flag changed state,
an OTA release introduced incompatible client logic.
That context often lives somewhere else.
Which is why error tracking becomes dramatically more useful when errors are attached directly to sessions.
ScaleBun's debugging model connects errors and crashes with the session in which they happened.
Instead of:
Error → stack trace
you can investigate:
Error → user → session → interactions → environment → release
That is a much richer debugging graph.
Reproduction is usually the expensive part#
Engineers spend surprising amounts of time trying to reproduce bugs.
QA sends steps.
Developer tries them.
Nothing happens.
QA tries again.
Works perfectly.
Developer develops trust issues.
The problem is that production environments contain state combinations your local environment doesn't.
Different:
devices
browsers
network conditions
user accounts
data
timing
application versions
A replay attached to an error gives you the actual path somebody took.
Not a reconstructed version of it written three hours later.
Errors also need prioritization#
Not every exception deserves a midnight Slack message.
A strange edge case affecting two ancient Android devices is not equivalent to an exception preventing 18% of users from completing onboarding.
Error systems become much more valuable when engineering teams can answer:
How often is this happening?
Who is affected?
Which journeys does it interrupt?
Which release introduced it?
That turns error monitoring from a pile of stack traces into an engineering priority system.
And that has direct business consequences.
Because the important question isn't:
“How many exceptions occurred?”
It's:
“Which exceptions are costing us customers?”
That's the question worth debugging.
Replay connected to errors and releases
See how ScaleBun attaches session replay to the rest of your debugging context.
See session replay→