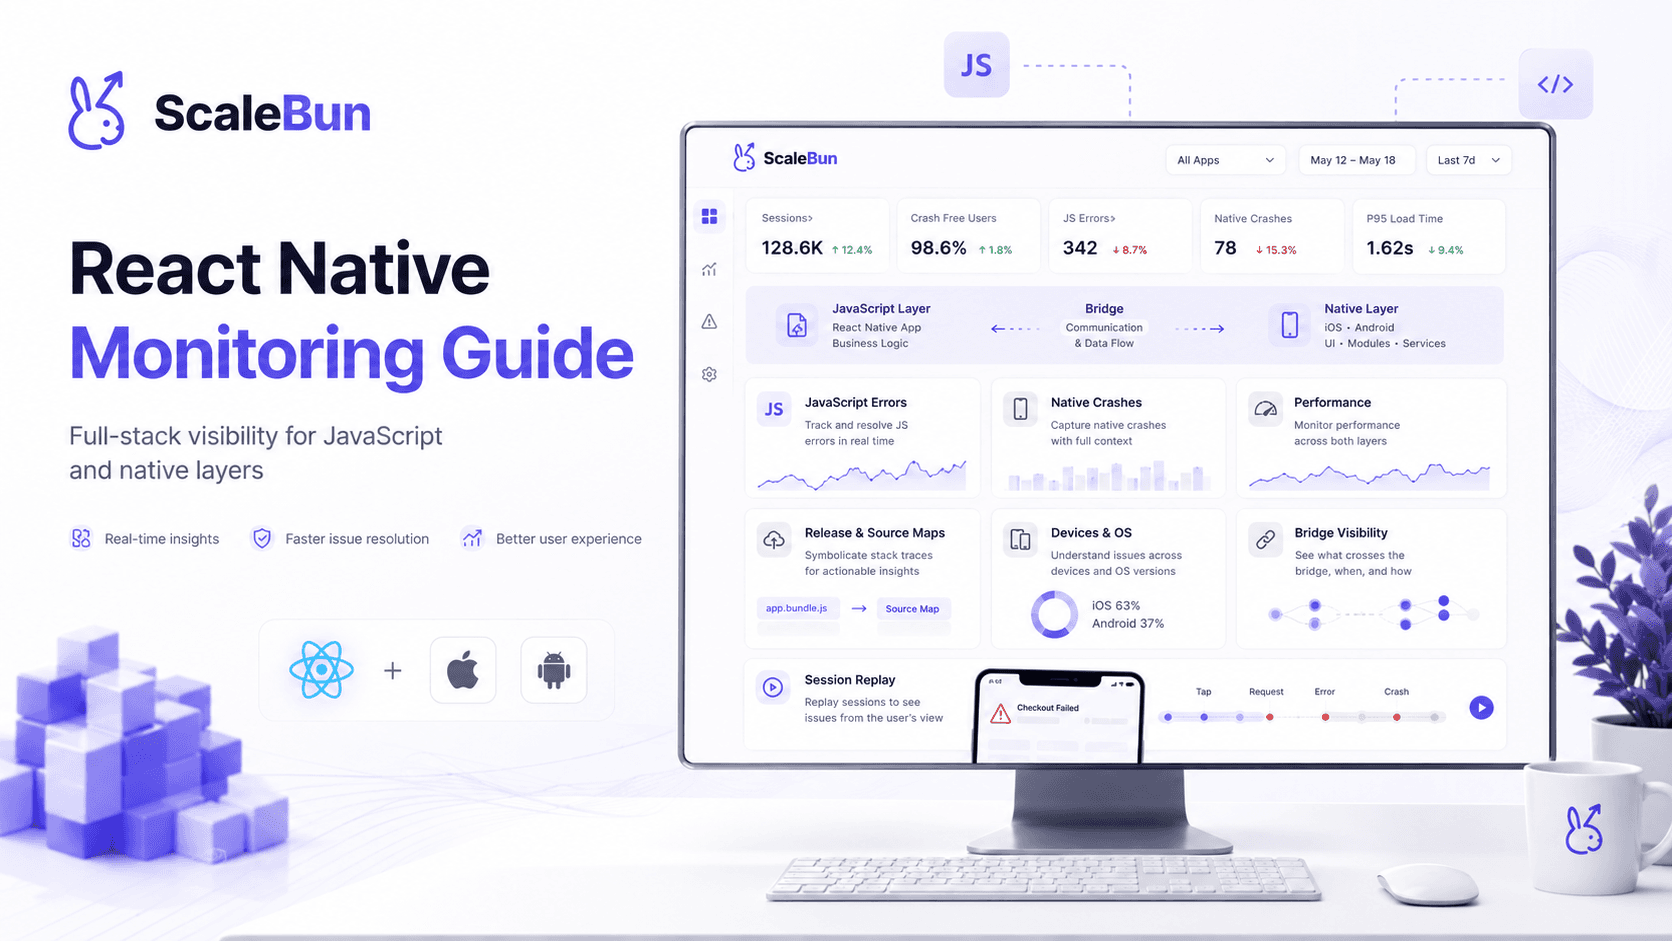
React Native Monitoring: A Practical Production Guide#
React Native combines JavaScript application code with native platform behavior.
That makes production monitoring more complicated than simply collecting JavaScript exceptions.
A useful React Native monitoring strategy should help teams understand:
JavaScript errors
Native crashes
Application releases
Source maps
Native symbolication
User sessions
Device context
User behavior
Release health
Why React Native Monitoring Is Different#
A React Native application can fail at multiple layers.
JavaScript layer#
Examples include:
Runtime exceptions
Component failures
State-related bugs
API handling problems
Native layer#
Examples include:
Android crashes
iOS crashes
Native module failures
Platform-specific issues
A monitoring strategy needs enough context to connect these layers.
Source Maps Matter#
Minified JavaScript makes production stack traces difficult to read.
Source maps allow teams to translate production locations back to the original source.
Without correct source-map handling, a crash can point to an unreadable bundle location instead of the source file developers actually need.
Android ProGuard and Native Symbolication#
Android builds can also use obfuscation.
When mapping files are available, production traces can be translated into useful symbols.
The important principle is:
Production errors should be mapped to the code developers recognize.
Specific ScaleBun symbolication capabilities should only be advertised where they are implemented and verified.
Releases Are a Core Dimension#
Every error should be understood in release context.
A useful model is:
Error → Release → Affected Users
This helps answer:
Did the error begin after the latest release?
Is the problem increasing?
Is the problem limited to one version?
Did the release affect a specific user segment?
Add Session Context#
A stack trace is stronger when paired with the session surrounding it.
The team may want to know:
What screen was open?
What did the user tap?
What happened immediately before the error?
Did the user retry?
Did the user leave?
This turns a technical event into a user-experience investigation.
React Native OTA Updates#
Over-the-air JavaScript updates introduce another important dimension.
When an application receives a JavaScript update, the team needs to know which bundle/version the user was running when an issue occurred.
The monitoring system should therefore distinguish application state clearly enough to answer:
Which exact release or update introduced the problem?
Release Health#
A production release should be evaluated using more than deployment success.
Useful signals include:
Crash rate
Error rate
User impact
Session impact
Conversion impact
Feature-specific behavior
This creates a stronger release-health workflow.
A Practical React Native Investigation#
A useful flow is:
Crash
→ Release
→ User
→ Session
→ Screen
→ Action
→ Feature
→ Outcome
This is the type of connected investigation ScaleBun is designed to support.
Final Takeaway#
React Native monitoring should not stop at stack traces.
The strongest monitoring workflow connects:
Code → Release → User → Session → Behavior → Outcome
That is how teams move from knowing that an error exists to understanding its real impact.
Explore ScaleBun#
Monitor the application and understand the experience around every important event.
Explore ScaleBun →
See the full picture across web and mobile.
Connect application health, user behavior, attribution, and product context with ScaleBun.
Explore ScaleBun →